
- Start >
- Rivers >
- Discharge >
- Unterer Main >
- Weilbach >
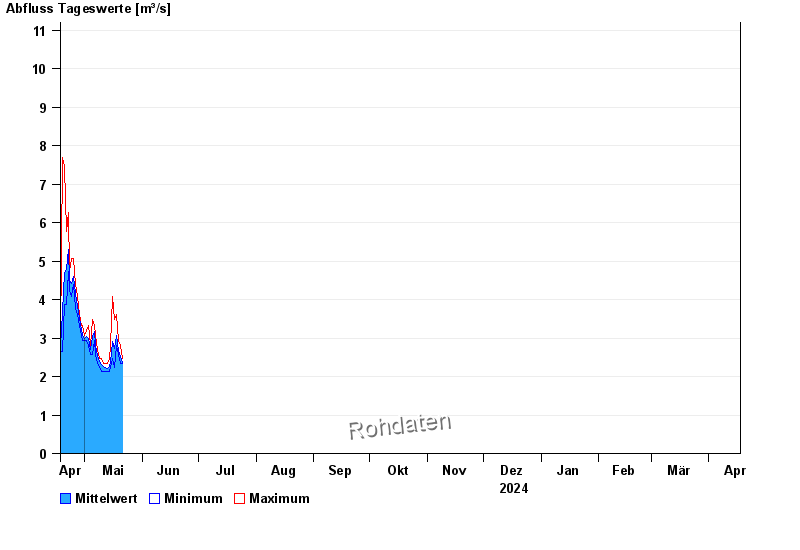
- Chart of year

Chart of year Weilbach / Mud
Discharge from 18.04.2024 to 17.04.2025
- 26.01.1995 Abfluss: 149 m³/s
- 21.12.1993 Abfluss: 127 m³/s
- 29.10.1998 Abfluss: 106 m³/s
- 01.03.2008 Abfluss: 103 m³/s
- 04.03.1956 Abfluss: 95,4 m³/s
| Date | Mean value [m³/s] | Maximum [m³/s] | Minimum [m³/s] |
|---|---|---|---|
| 20.05.2024 | 2.53 | 2.81 | 2.35 |
| 19.05.2024 | 2.68 | 2.94 | 2.57 |
| 18.05.2024 | 3.06 | 3.61 | 2.81 |
| 17.05.2024 | 2.73 | 3.47 | 2.24 |
| 16.05.2024 | 2.92 | 4.07 | 2.46 |
| 15.05.2024 | 2.36 | 2.81 | 2.24 |
| 14.05.2024 | 2.26 | 2.46 | 2.14 |
© Bayerisches Landesamt für Umwelt 2024