
- Start >
- Rivers >
- Discharge >
- Unterer Main >
- Weilbach >
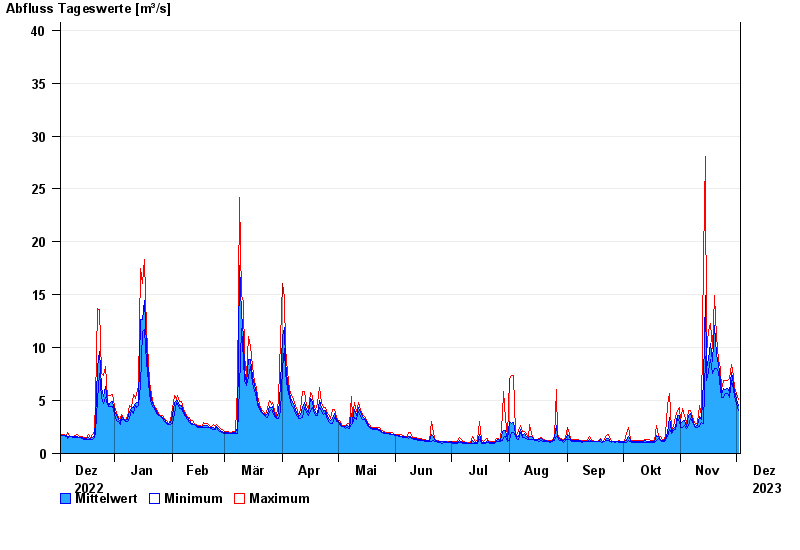
- Chart of year

Chart of year Weilbach / Mud
Discharge from 03.12.2022 to 02.12.2023
- 26.01.1995 Abfluss: 149 m³/s
- 21.12.1993 Abfluss: 127 m³/s
- 29.10.1998 Abfluss: 106 m³/s
- 01.03.2008 Abfluss: 103 m³/s
- 04.03.1956 Abfluss: 95,4 m³/s
| Date | Mean value [m³/s] | Maximum [m³/s] | Minimum [m³/s] |
|---|---|---|---|
| 02.12.2023 | 4.53 | 5.06 | 4.05 |
| 01.12.2023 | 5.14 | 5.63 | 4.71 |
| 30.11.2023 | 5.84 | 6.23 | 5.43 |
| 29.11.2023 | 6.56 | 7.3 | 6.03 |
| 28.11.2023 | 7.69 | 8.44 | 6.87 |
| 27.11.2023 | 5.79 | 7.09 | 5.25 |
| 26.11.2023 | 6.15 | 6.87 | 5.63 |
© Bayerisches Landesamt für Umwelt 2024