
- Start >
- Rivers >
- Discharge >
- Unterer Main >
- Weilbach >
- Chart of year

Chart of year Weilbach / Mud
Discharge from 01.01.2022 to 31.12.2022
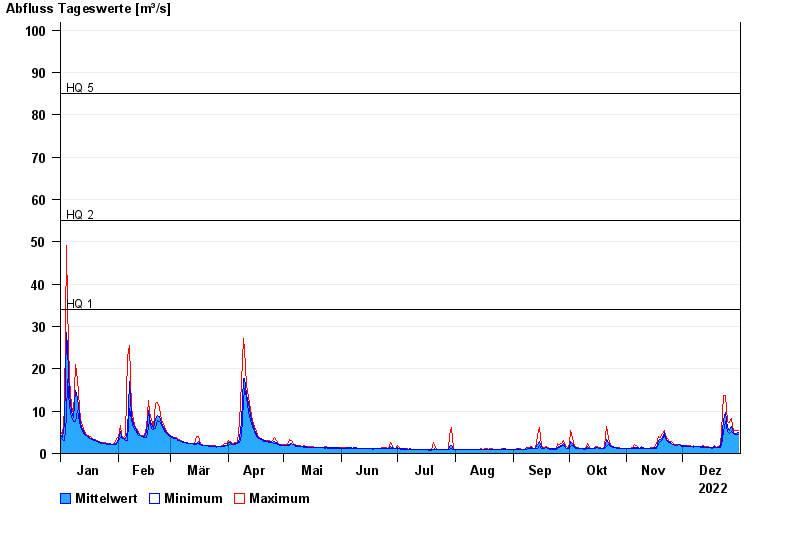
- HQ1 34 m³/s
- HQ2 55 m³/s
- HQ5 85 m³/s
- HQ10 105 m³/s
- HQ20 130 m³/s
- HQ50 155 m³/s
- HQ100 180 m³/s
| Date | Mean value [m³/s] | Maximum [m³/s] | Minimum [m³/s] |
|---|---|---|---|
| 31.12.2022 | 4.95 | 5.53 | 4.47 |
| 30.12.2022 | 4.83 | 5.52 | 4.46 |
| 29.12.2022 | 4.58 | 5.52 | 4.45 |
| 28.12.2022 | 4.95 | 5.31 | 4.61 |
| 27.12.2022 | 6.37 | 8.26 | 5.31 |
| 26.12.2022 | 5.39 | 7.36 | 4.76 |
| 25.12.2022 | 6.23 | 7.56 | 5.3 |
© Bayerisches Landesamt für Umwelt 2024