
- Start >
- Rivers >
- Discharge >
- Unterer Main >
- Weilbach >
- Chart of year

Chart of year Weilbach / Mud
Discharge from 01.01.2020 to 31.12.2020
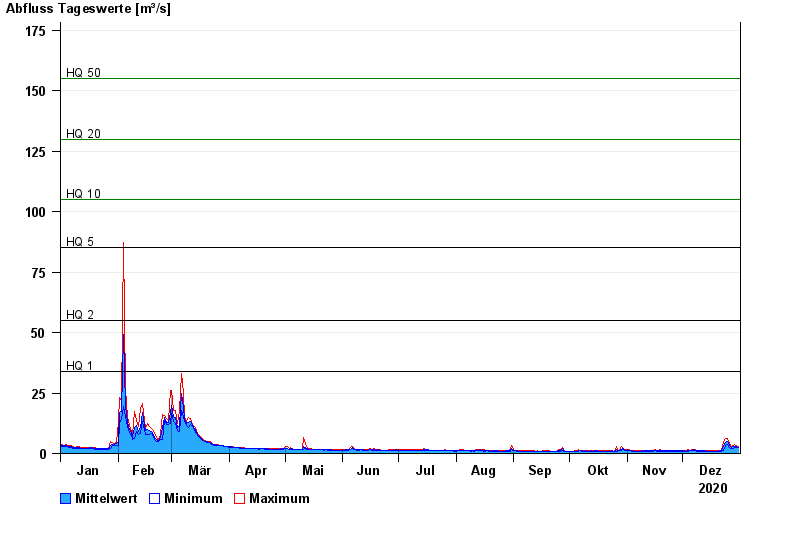
- HQ1 34 m³/s
- HQ2 55 m³/s
- HQ5 85 m³/s
- HQ10 105 m³/s
- HQ20 130 m³/s
- HQ50 155 m³/s
- HQ100 180 m³/s
| Date | Mean value [m³/s] | Maximum [m³/s] | Minimum [m³/s] |
|---|---|---|---|
| 31.12.2020 | 2.63 | 3.06 | 2.34 |
| 30.12.2020 | 2.78 | 3.32 | 2.45 |
| 29.12.2020 | 3.09 | 3.6 | 2.68 |
| 28.12.2020 | 2.74 | 3.32 | 2.12 |
| 27.12.2020 | 2.45 | 2.81 | 2.14 |
| 26.12.2020 | 3.21 | 4.23 | 2.57 |
| 25.12.2020 | 5.02 | 6.07 | 3.91 |
© Bayerisches Landesamt für Umwelt 2024