
- Start >
- Rivers >
- Discharge >
- Unterer Main >
- Untermerzbach >
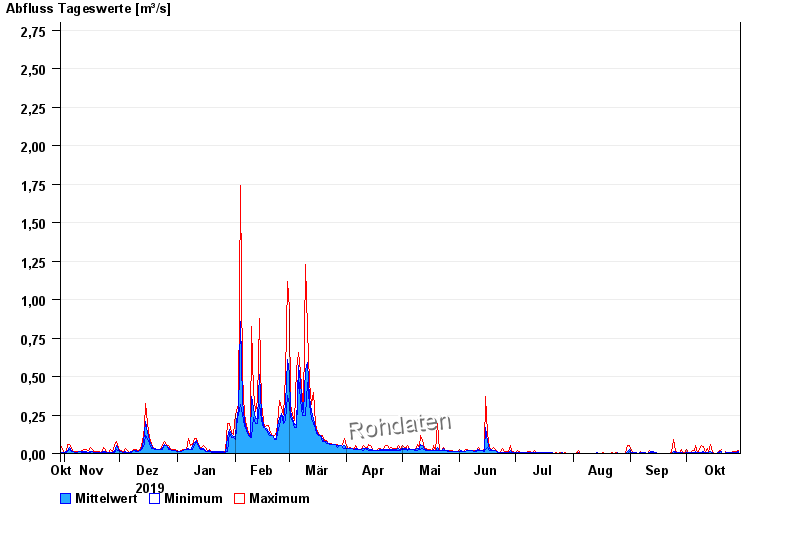
- Chart of year

Chart of year Untermerzbach / Merzbach
Discharge from 30.10.2019 to 29.10.2020
- 30.06.1999 Abfluss: 6,35 m³/s
- 23.01.1995 Abfluss: 5,7 m³/s
- 22.04.1989 Abfluss: 5,03 m³/s
- 01.04.1988 Abfluss: 4,89 m³/s
- 07.02.1984 Abfluss: 4,88 m³/s
| Date | Mean value [m³/s] | Maximum [m³/s] | Minimum [m³/s] |
|---|---|---|---|
| 29.10.2020 | 0.01 | 0.019 | 0.008 |
| 28.10.2020 | 0.009 | 0.015 | 0.006 |
| 27.10.2020 | 0.008 | 0.015 | 0.006 |
| 26.10.2020 | 0.009 | 0.011 | 0.008 |
| 25.10.2020 | 0.007 | 0.008 | 0.006 |
| 24.10.2020 | 0.007 | 0.008 | 0.006 |
| 23.10.2020 | 0.005 | 0.008 | 0.004 |
© Bayerisches Landesamt für Umwelt 2024