
- Start >
- Rivers >
- Discharge >
- Unterer Main >
- Untermerzbach >
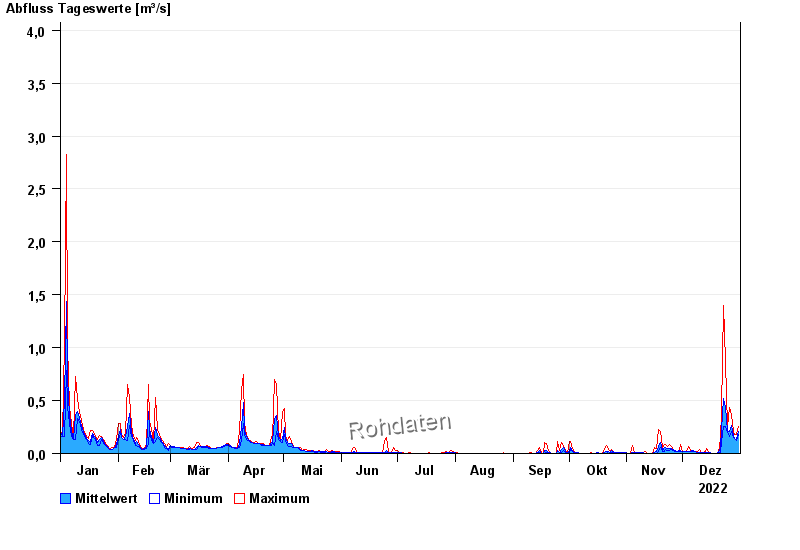
- Chart of year

Chart of year Untermerzbach / Merzbach
Discharge from 01.01.2022 to 31.12.2022
- 30.06.1999 Abfluss: 6,35 m³/s
- 23.01.1995 Abfluss: 5,7 m³/s
- 22.04.1989 Abfluss: 5,03 m³/s
- 01.04.1988 Abfluss: 4,89 m³/s
- 07.02.1984 Abfluss: 4,88 m³/s
| Date | Mean value [m³/s] | Maximum [m³/s] | Minimum [m³/s] |
|---|---|---|---|
| 31.12.2022 | 0.206 | 0.251 | 0.179 |
| 30.12.2022 | 0.137 | 0.179 | 0.125 |
| 29.12.2022 | 0.142 | 0.179 | 0.138 |
| 28.12.2022 | 0.168 | 0.212 | 0.151 |
| 27.12.2022 | 0.261 | 0.372 | 0.212 |
| 26.12.2022 | 0.205 | 0.433 | 0.164 |
| 25.12.2022 | 0.219 | 0.251 | 0.195 |
© Bayerisches Landesamt für Umwelt 2024