
- Start >
- Rivers >
- Discharge >
- Unterer Main >
- Trunstadt >
- Chart of month

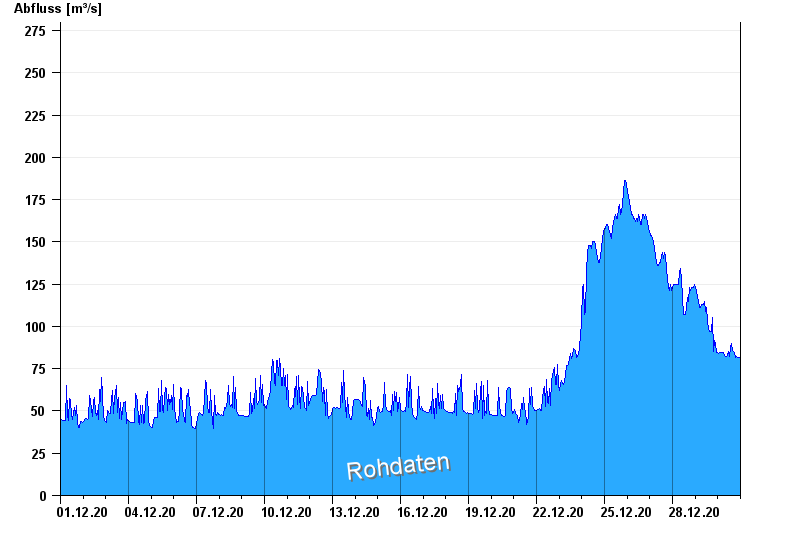
Chart of month Trunstadt / Main
Discharge from 01.12.2020 to 30.12.2020
- 04.01.2003 Abfluss: 1430 m³/s
- 30.12.1947 Abfluss: 1340 m³/s
- 07.01.1982 Abfluss: 1310 m³/s
- 27.01.1995 Abfluss: 1310 m³/s
- 02.04.1988 Abfluss: 1180 m³/s
| Date | Runoff [m³/s] |
|---|---|
| 30.12.2020 23:45 | 81.4 |
| 30.12.2020 23:30 | 81.4 |
| 30.12.2020 23:15 | 81.4 |
| 30.12.2020 23:00 | 81.3 |
| 30.12.2020 22:45 | 81.4 |
| 30.12.2020 22:30 | 81.5 |
| 30.12.2020 22:15 | 81.5 |
© Bayerisches Landesamt für Umwelt 2024