
- Start >
- Rivers >
- Discharge >
- Unterer Main >
- Stockheim >
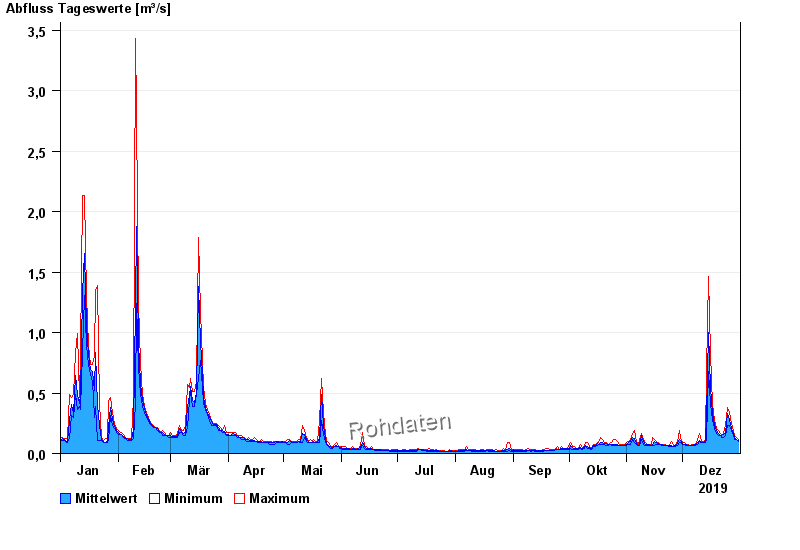
- Chart of year

Chart of year Stockheim / Sulz
Discharge from 01.01.2019 to 31.12.2019
| Date | Mean value [m³/s] | Maximum [m³/s] | Minimum [m³/s] |
|---|---|---|---|
| 31.12.2019 | 0.105 | 0.117 | 0.102 |
| 30.12.2019 | 0.118 | 0.134 | 0.117 |
| 29.12.2019 | 0.136 | 0.151 | 0.117 |
| 28.12.2019 | 0.166 | 0.188 | 0.151 |
| 27.12.2019 | 0.209 | 0.248 | 0.188 |
| 26.12.2019 | 0.282 | 0.335 | 0.228 |
| 25.12.2019 | 0.329 | 0.382 | 0.228 |
© Bayerisches Landesamt für Umwelt 2024