
- Start >
- Rivers >
- Discharge >
- Unterer Main >
- Schweinhof >
- Chart of year

Chart of year Schweinhof / Brend
Discharge from 01.01.2019 to 31.12.2019
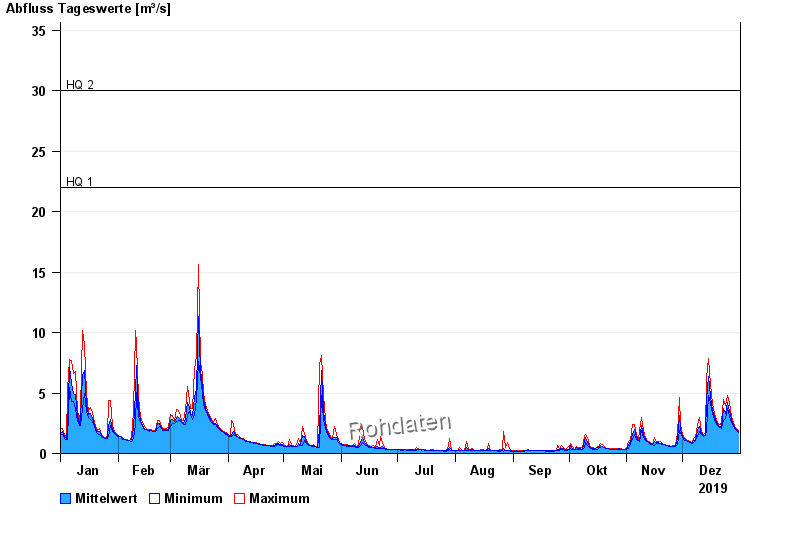
- HQ1 22 m³/s
- HQ2 30 m³/s
- HQ5 41 m³/s
- HQ10 49 m³/s
- HQ20 56 m³/s
- HQ50 65 m³/s
- HQ100 70 m³/s
| Date | Mean value [m³/s] | Maximum [m³/s] | Minimum [m³/s] |
|---|---|---|---|
| 31.12.2019 | 1.85 | 1.94 | 1.77 |
| 30.12.2019 | 1.98 | 2.06 | 1.94 |
| 29.12.2019 | 2.15 | 2.24 | 2.06 |
| 28.12.2019 | 2.42 | 2.57 | 2.24 |
| 27.12.2019 | 2.82 | 3.06 | 2.57 |
| 26.12.2019 | 3.47 | 4.21 | 3.06 |
| 25.12.2019 | 4.19 | 4.78 | 3.69 |
© Bayerisches Landesamt für Umwelt 2024