
- Start >
- Rivers >
- Discharge >
- Unterer Main >
- Schweinhof >
- Chart of year

Chart of year Schweinhof / Brend
Discharge from 20.08.2020 to 19.08.2021
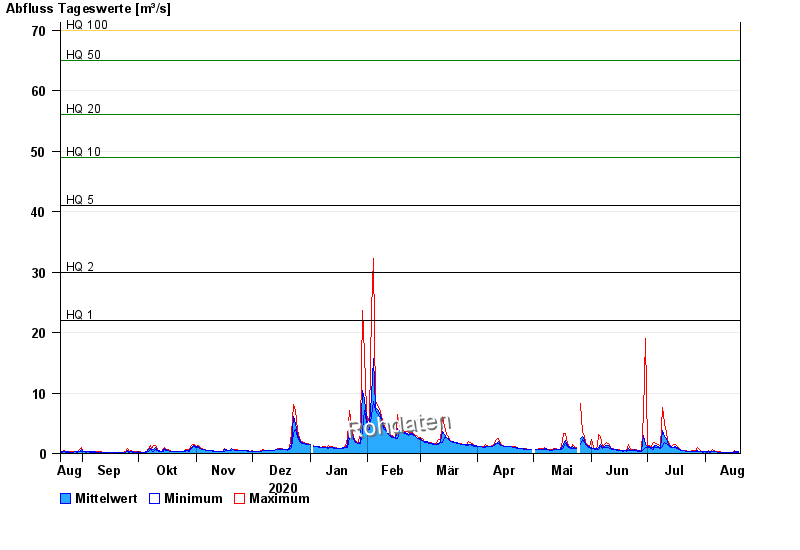
- HQ1 22 m³/s
- HQ2 30 m³/s
- HQ5 41 m³/s
- HQ10 49 m³/s
- HQ20 56 m³/s
- HQ50 65 m³/s
- HQ100 70 m³/s
| Date | Mean value [m³/s] | Maximum [m³/s] | Minimum [m³/s] |
|---|---|---|---|
| 19.08.2021 | 0.269 | 0.322 | 0.242 |
| 18.08.2021 | 0.273 | 0.322 | 0.219 |
| 17.08.2021 | 0.268 | 0.415 | 0.18 |
| 16.08.2021 | 0.164 | 0.18 | 0.163 |
| 15.08.2021 | 0.168 | 0.18 | 0.163 |
| 14.08.2021 | 0.184 | 0.219 | 0.163 |
| 13.08.2021 | 0.188 | 0.199 | 0.18 |
© Bayerisches Landesamt für Umwelt 2024