
- Start >
- Rivers >
- Discharge >
- Unterer Main >
- Schweinhof >
- Chart of year

Chart of year Schweinhof / Brend
Discharge from 12.08.2022 to 11.08.2023
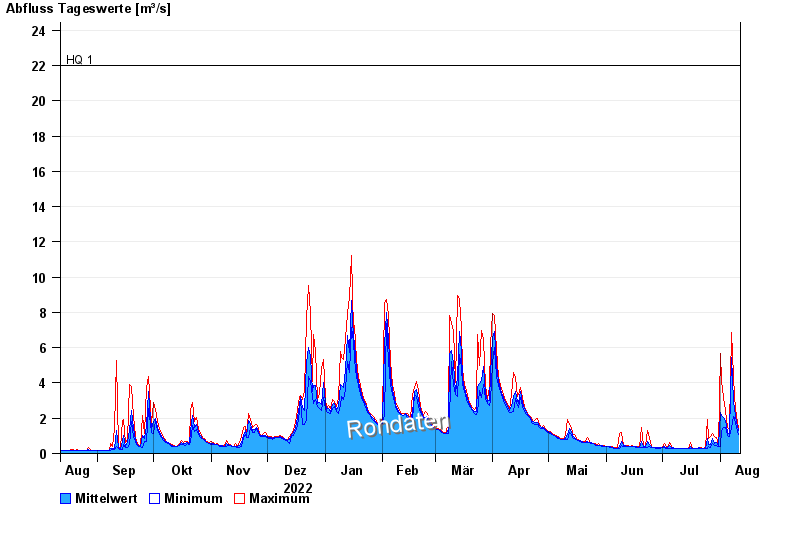
- HQ1 22 m³/s
- HQ2 30 m³/s
- HQ5 41 m³/s
- HQ10 49 m³/s
- HQ20 56 m³/s
- HQ50 65 m³/s
- HQ100 70 m³/s
| Date | Mean value [m³/s] | Maximum [m³/s] | Minimum [m³/s] |
|---|---|---|---|
| 11.08.2023 | 1.3 | 1.45 | 1.09 |
| 10.08.2023 | 1.77 | 2.12 | 1.45 |
| 09.08.2023 | 2.53 | 3.15 | 2.01 |
| 08.08.2023 | 2.94 | 4.42 | 2.12 |
| 07.08.2023 | 5.45 | 6.84 | 1.45 |
| 06.08.2023 | 1.14 | 1.39 | 0.96 |
| 05.08.2023 | 1.19 | 1.5 | 1 |
© Bayerisches Landesamt für Umwelt 2024