
- Start >
- Rivers >
- Discharge >
- Unterer Main >
- Schweinfurt Neuer Hafen >
- Chart of year

Chart of year Schweinfurt Neuer Hafen / Main
Discharge from 01.01.2017 to 31.12.2017
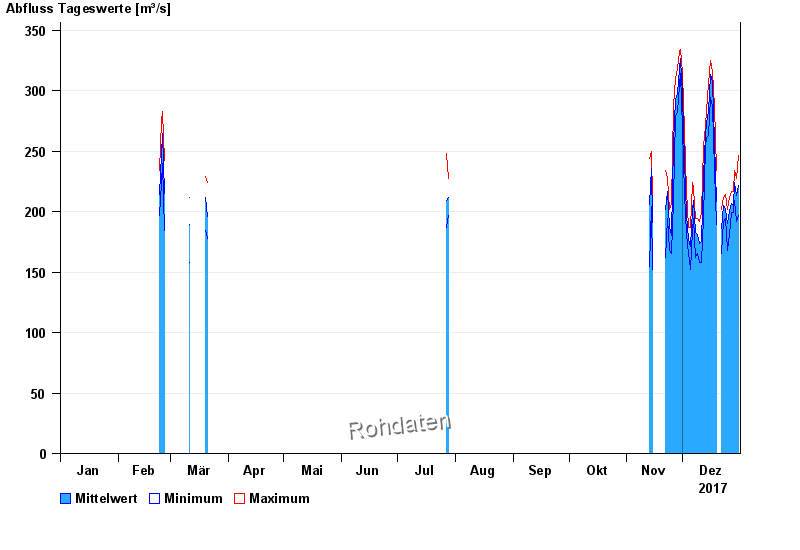
| Date | Mean value [m³/s] | Maximum [m³/s] | Minimum [m³/s] |
|---|---|---|---|
| 31.12.2017 | 222 | 246 | 197 |
| 30.12.2017 | 213 | 227 | 192 |
| 29.12.2017 | 224 | 234 | 209 |
| 28.12.2017 | 205 | 217 | 199 |
| 27.12.2017 | 207 | 217 | 199 |
| 26.12.2017 | 201 | 212 | 181 |
| 25.12.2017 | 190 | 202 | 168 |
© Bayerisches Landesamt für Umwelt 2024