
- Start >
- Rivers >
- Discharge >
- Unterer Main >
- Scheinfeld >
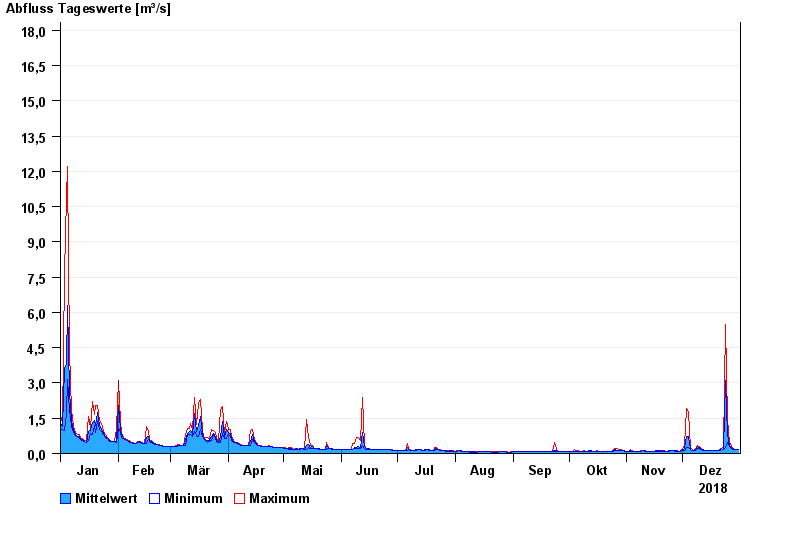
- Chart of year

Chart of year Scheinfeld / Scheine
Discharge from 01.01.2018 to 31.12.2018
- 09.07.2021 Abfluss: 54,3 m³/s
- 31.05.2013 Abfluss: 32,6 m³/s
- 08.12.2010 Abfluss: 24,3 m³/s
- 01.06.2013 Abfluss: 23,2 m³/s
- 13.04.1994 Abfluss: 23,2 m³/s
| Date | Mean value [m³/s] | Maximum [m³/s] | Minimum [m³/s] |
|---|---|---|---|
| 31.12.2018 | 0.173 | 0.179 | 0.171 |
| 30.12.2018 | 0.18 | 0.187 | 0.171 |
| 29.12.2018 | 0.174 | 0.187 | 0.171 |
| 28.12.2018 | 0.197 | 0.222 | 0.183 |
| 27.12.2018 | 0.246 | 0.289 | 0.222 |
| 26.12.2018 | 0.359 | 0.483 | 0.289 |
| 25.12.2018 | 0.788 | 1.43 | 0.483 |
© Bayerisches Landesamt für Umwelt 2024