
- Start >
- Rivers >
- Discharge >
- Unterer Main >
- Sachsenheim >
- Chart of year

Chart of year Sachsenheim / Wern
Discharge from 30.05.2019 to 29.05.2020
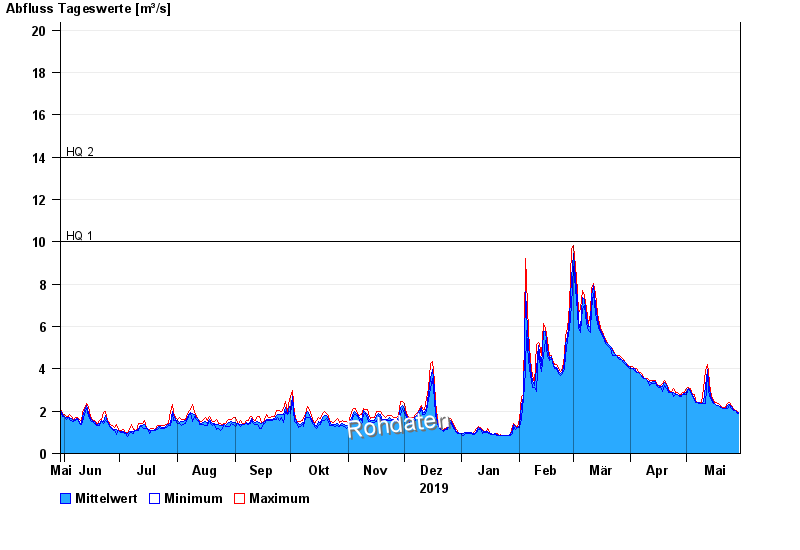
- HQ1 10 m³/s
- HQ2 14 m³/s
- HQ5 21 m³/s
- HQ10 27 m³/s
- HQ20 33 m³/s
- HQ50 44 m³/s
- HQ100 53 m³/s
| Date | Mean value [m³/s] | Maximum [m³/s] | Minimum [m³/s] |
|---|---|---|---|
| 29.05.2020 | 1.92 | 1.95 | 1.87 |
| 28.05.2020 | 1.98 | 2.02 | 1.95 |
| 27.05.2020 | 2.02 | 2.02 | 2.02 |
| 26.05.2020 | 2.04 | 2.11 | 2.02 |
| 25.05.2020 | 2.21 | 2.27 | 2.11 |
| 24.05.2020 | 2.31 | 2.43 | 2.27 |
| 23.05.2020 | 2.26 | 2.34 | 2.11 |
© Bayerisches Landesamt für Umwelt 2024