
- Start >
- Rivers >
- Discharge >
- Unterer Main >
- Sachsenheim >
- Chart of year

Chart of year Sachsenheim / Wern
Discharge from 19.06.2020 to 18.06.2021
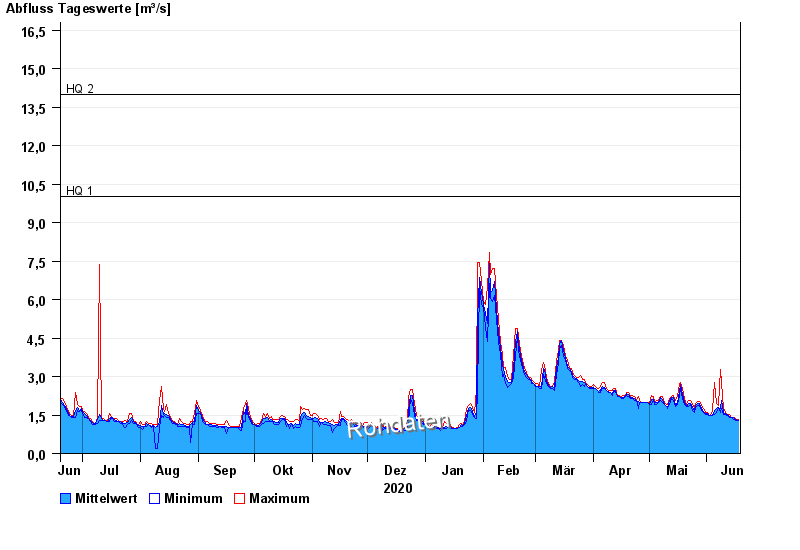
- HQ1 10 m³/s
- HQ2 14 m³/s
- HQ5 21 m³/s
- HQ10 27 m³/s
- HQ20 33 m³/s
- HQ50 44 m³/s
- HQ100 53 m³/s
| Date | Mean value [m³/s] | Maximum [m³/s] | Minimum [m³/s] |
|---|---|---|---|
| 18.06.2021 | 1.28 | 1.34 | 1.28 |
| 17.06.2021 | 1.34 | 1.34 | 1.28 |
| 16.06.2021 | 1.34 | 1.4 | 1.34 |
| 15.06.2021 | 1.39 | 1.4 | 1.34 |
| 14.06.2021 | 1.4 | 1.4 | 1.4 |
| 13.06.2021 | 1.45 | 1.53 | 1.4 |
| 12.06.2021 | 1.52 | 1.53 | 1.47 |
© Bayerisches Landesamt für Umwelt 2024