
- Start >
- Rivers >
- Discharge >
- Unterer Main >
- Rödenweiler >
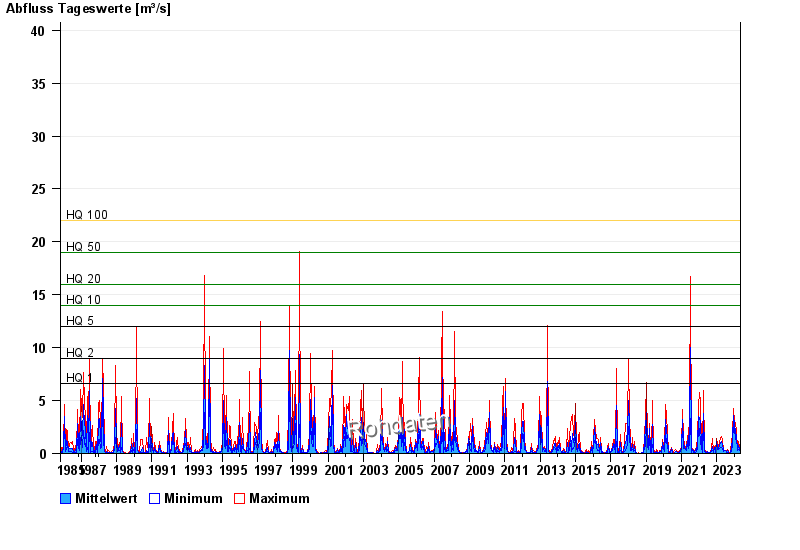
- Chart of total period

Chart of total period Rödenweiler / Sulzach
Discharge from 01.11.1985 to 08.05.2024
note
Wasserstand und Abfluss wird zeitweise durch Biberdamm beeinflusst.
- HQ1 6,6 m³/s
- HQ2 9 m³/s
- HQ5 12 m³/s
- HQ10 14 m³/s
- HQ20 16 m³/s
- HQ50 19 m³/s
- HQ100 22 m³/s
| Date | Mean value [m³/s] | Maximum [m³/s] | Minimum [m³/s] |
|---|---|---|---|
| 08.05.2024 | 0.054 | 0.069 | 0.05 |
| 07.05.2024 | 0.079 | 0.116 | 0.059 |
| 06.05.2024 | 0.145 | 0.206 | 0.116 |
| 05.05.2024 | 0.106 | 0.206 | 0.05 |
| 04.05.2024 | 0.185 | 0.286 | 0.104 |
| 03.05.2024 | 0.55 | 0.822 | 0.292 |
| 02.05.2024 | 0.108 | 0.694 | 0.035 |
© Bayerisches Landesamt für Umwelt 2024