
- Start >
- Rivers >
- Discharge >
- Unterer Main >
- Poppenlauer >
- Chart of year

Chart of year Poppenlauer / Lauer
Discharge from 01.01.2023 to 31.12.2023
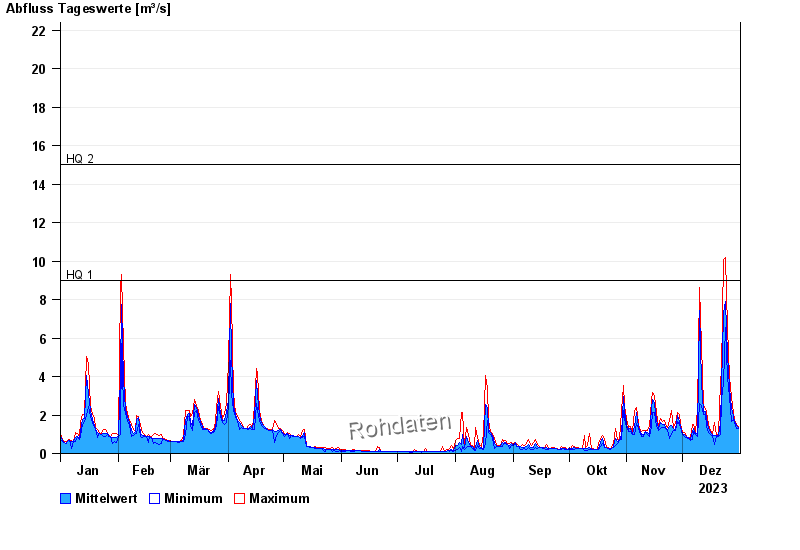
- HQ1 9 m³/s
- HQ2 15 m³/s
- HQ5 26 m³/s
- HQ10 34 m³/s
- HQ20 42 m³/s
- HQ50 54 m³/s
- HQ100 63 m³/s
| Date | Mean value [m³/s] | Maximum [m³/s] | Minimum [m³/s] |
|---|---|---|---|
| 31.12.2023 | 1.34 | 1.39 | 1.32 |
| 30.12.2023 | 1.46 | 1.53 | 1.32 |
| 29.12.2023 | 1.67 | 1.77 | 1.61 |
| 28.12.2023 | 1.92 | 2.11 | 1.77 |
| 27.12.2023 | 2.36 | 2.9 | 1.68 |
| 26.12.2023 | 3.45 | 3.97 | 2.9 |
| 25.12.2023 | 5.1 | 6.55 | 3.97 |
© Bayerisches Landesamt für Umwelt 2024