
- Start >
- Rivers >
- Discharge >
- Unterer Main >
- Poppenlauer >
- Chart of year

Chart of year Poppenlauer / Lauer
Discharge from 01.01.2021 to 31.12.2021
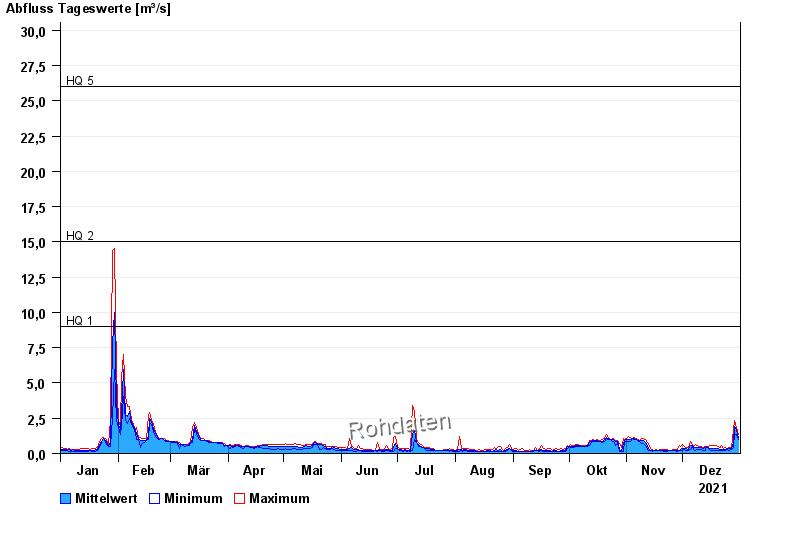
- HQ1 9 m³/s
- HQ2 15 m³/s
- HQ5 26 m³/s
- HQ10 34 m³/s
- HQ20 42 m³/s
- HQ50 54 m³/s
- HQ100 63 m³/s
| Date | Mean value [m³/s] | Maximum [m³/s] | Minimum [m³/s] |
|---|---|---|---|
| 31.12.2021 | 1.13 | 1.38 | 0.986 |
| 30.12.2021 | 1.61 | 1.84 | 1.38 |
| 29.12.2021 | 1.88 | 2.36 | 1.45 |
| 28.12.2021 | 0.75 | 1.68 | 0.432 |
| 27.12.2021 | 0.347 | 0.432 | 0.265 |
| 26.12.2021 | 0.333 | 0.432 | 0.223 |
| 25.12.2021 | 0.353 | 0.369 | 0.313 |
© Bayerisches Landesamt für Umwelt 2024