
- Start >
- Rivers >
- Discharge >
- Unterer Main >
- Pfarrweisach >
- Chart of year

Chart of year Pfarrweisach / Weisach
Discharge from 19.09.2021 to 18.09.2022
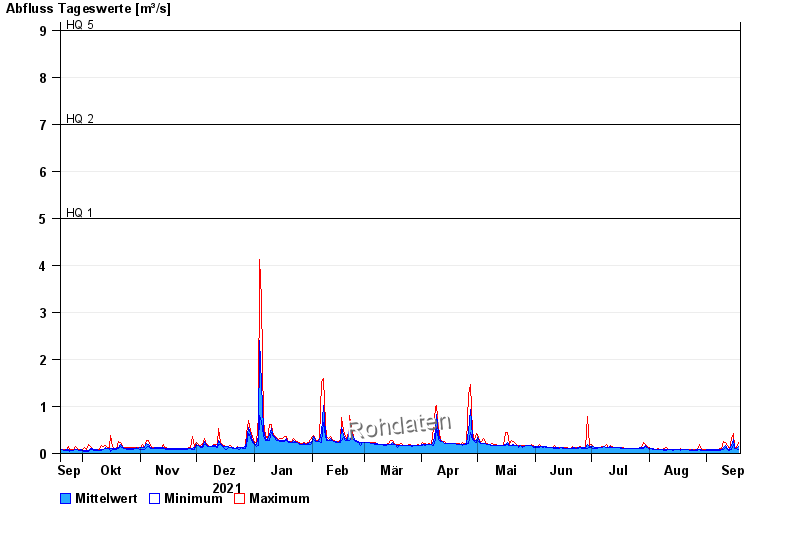
- HQ1 5 m³/s
- HQ2 7 m³/s
- HQ5 9 m³/s
- HQ10 11,5 m³/s
- HQ20 14,5 m³/s
- HQ50 18 m³/s
- HQ100 22 m³/s
| Date | Mean value [m³/s] | Maximum [m³/s] | Minimum [m³/s] |
|---|---|---|---|
| 18.09.2022 | 0.146 | 0.236 | 0.093 |
| 17.09.2022 | 0.115 | 0.133 | 0.113 |
| 16.09.2022 | 0.117 | 0.145 | 0.102 |
| 15.09.2022 | 0.298 | 0.427 | 0.184 |
| 14.09.2022 | 0.163 | 0.32 | 0.091 |
| 13.09.2022 | 0.085 | 0.091 | 0.064 |
| 12.09.2022 | 0.108 | 0.171 | 0.082 |
© Bayerisches Landesamt für Umwelt 2024