
- Start >
- Rivers >
- Discharge >
- Unterer Main >
- Pfarrweisach >
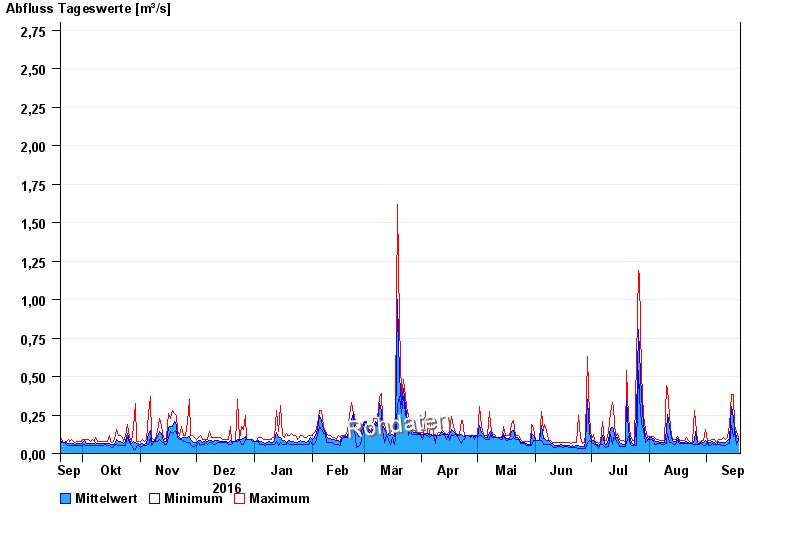
- Chart of year

Chart of year Pfarrweisach / Weisach
Discharge from 19.09.2016 to 18.09.2017
- 23.01.1995 Abfluss: 28,8 m³/s
- 08.12.1981 Abfluss: 17,6 m³/s
- 12.04.2008 Abfluss: 16,8 m³/s
- 05.01.1982 Abfluss: 16,5 m³/s
- 01.04.1988 Abfluss: 15,8 m³/s
| Date | Mean value [m³/s] | Maximum [m³/s] | Minimum [m³/s] |
|---|---|---|---|
| 18.09.2017 | 0.099 | 0.101 | 0.091 |
| 17.09.2017 | 0.104 | 0.144 | 0.058 |
| 16.09.2017 | 0.158 | 0.18 | 0.144 |
| 15.09.2017 | 0.236 | 0.382 | 0.111 |
| 14.09.2017 | 0.307 | 0.382 | 0.18 |
| 13.09.2017 | 0.094 | 0.18 | 0.066 |
| 12.09.2017 | 0.087 | 0.101 | 0.058 |
© Bayerisches Landesamt für Umwelt 2024