
- Start >
- Rivers >
- Discharge >
- Unterer Main >
- Pfarrweisach >
- Chart of year

Chart of year Pfarrweisach / Weisach
Discharge from 18.11.2019 to 17.11.2020
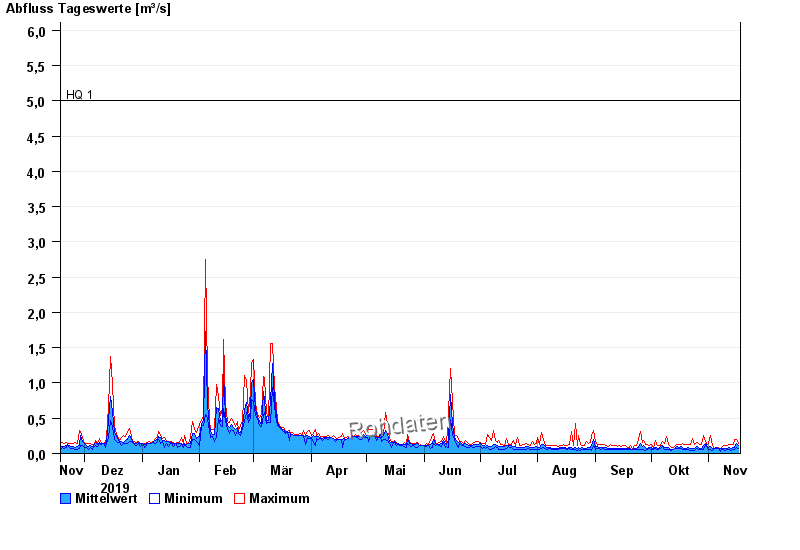
- HQ1 5 m³/s
- HQ2 7 m³/s
- HQ5 9 m³/s
- HQ10 11,5 m³/s
- HQ20 14,5 m³/s
- HQ50 18 m³/s
- HQ100 22 m³/s
| Date | Mean value [m³/s] | Maximum [m³/s] | Minimum [m³/s] |
|---|---|---|---|
| 17.11.2020 | 0.117 | 0.144 | 0.075 |
| 16.11.2020 | 0.147 | 0.193 | 0.083 |
| 15.11.2020 | 0.089 | 0.193 | 0.06 |
| 14.11.2020 | 0.087 | 0.133 | 0.06 |
| 13.11.2020 | 0.077 | 0.133 | 0.046 |
| 12.11.2020 | 0.083 | 0.122 | 0.052 |
| 11.11.2020 | 0.07 | 0.111 | 0.052 |
© Bayerisches Landesamt für Umwelt 2024