
- Start >
- Rivers >
- Discharge >
- Unterer Main >
- Pfarrweisach >
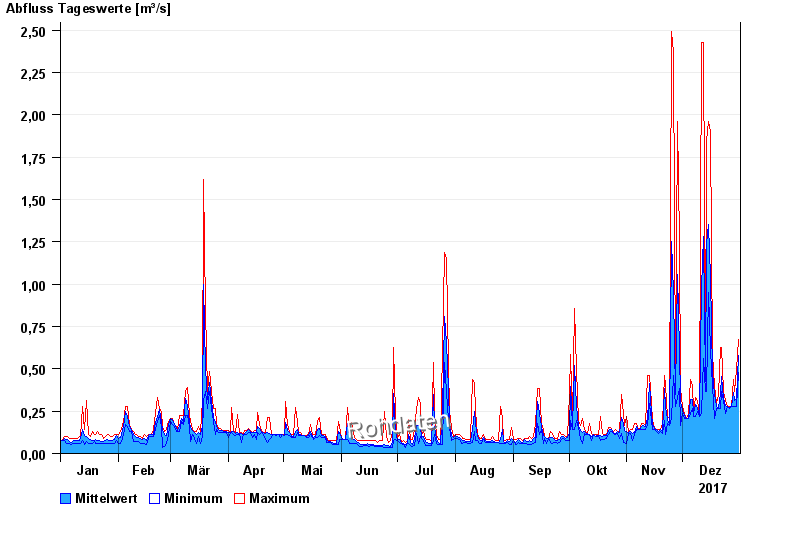
- Chart of year

Chart of year Pfarrweisach / Weisach
Discharge from 01.01.2017 to 31.12.2017
| Date | Mean value [m³/s] | Maximum [m³/s] | Minimum [m³/s] |
|---|---|---|---|
| 31.12.2017 | 0.581 | 0.675 | 0.478 |
| 30.12.2017 | 0.317 | 0.499 | 0.279 |
| 29.12.2017 | 0.313 | 0.364 | 0.279 |
| 28.12.2017 | 0.36 | 0.439 | 0.279 |
| 27.12.2017 | 0.279 | 0.279 | 0.279 |
| 26.12.2017 | 0.269 | 0.279 | 0.264 |
| 25.12.2017 | 0.279 | 0.279 | 0.279 |
© Bayerisches Landesamt für Umwelt 2024