
- Start >
- Rivers >
- Discharge >
- Unterer Main >
- Pfarrweisach >
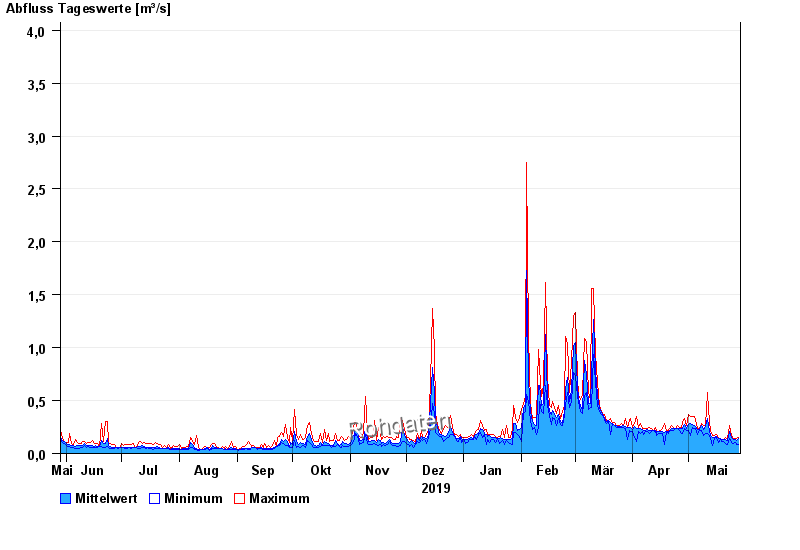
- Chart of year

Chart of year Pfarrweisach / Weisach
Discharge from 29.05.2019 to 28.05.2020
- 23.01.1995 Abfluss: 28,8 m³/s
- 08.12.1981 Abfluss: 17,6 m³/s
- 12.04.2008 Abfluss: 16,8 m³/s
- 05.01.1982 Abfluss: 16,5 m³/s
- 01.04.1988 Abfluss: 15,8 m³/s
| Date | Mean value [m³/s] | Maximum [m³/s] | Minimum [m³/s] |
|---|---|---|---|
| 28.05.2020 | 0.14 | 0.153 | 0.088 |
| 27.05.2020 | 0.125 | 0.142 | 0.088 |
| 26.05.2020 | 0.128 | 0.142 | 0.108 |
| 25.05.2020 | 0.137 | 0.142 | 0.098 |
| 24.05.2020 | 0.147 | 0.166 | 0.108 |
| 23.05.2020 | 0.205 | 0.264 | 0.142 |
| 22.05.2020 | 0.126 | 0.142 | 0.088 |
© Bayerisches Landesamt für Umwelt 2024