
- Start >
- Rivers >
- Discharge >
- Unterer Main >
- Pfarrweisach >
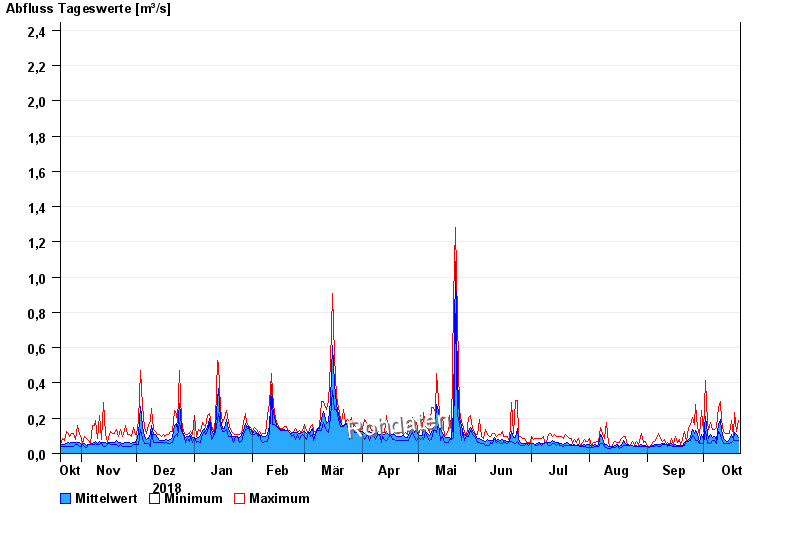
- Chart of year

Chart of year Pfarrweisach / Weisach
Discharge from 21.10.2018 to 20.10.2019
- 23.01.1995 Abfluss: 28,8 m³/s
- 08.12.1981 Abfluss: 17,6 m³/s
- 12.04.2008 Abfluss: 16,8 m³/s
- 05.01.1982 Abfluss: 16,5 m³/s
- 01.04.1988 Abfluss: 15,8 m³/s
| Date | Mean value [m³/s] | Maximum [m³/s] | Minimum [m³/s] |
|---|---|---|---|
| 20.10.2019 | 0.093 | 0.188 | 0.072 |
| 19.10.2019 | 0.106 | 0.124 | 0.072 |
| 18.10.2019 | 0.118 | 0.231 | 0.072 |
| 17.10.2019 | 0.079 | 0.102 | 0.072 |
| 16.10.2019 | 0.105 | 0.188 | 0.063 |
| 15.10.2019 | 0.078 | 0.113 | 0.055 |
| 14.10.2019 | 0.066 | 0.113 | 0.055 |
© Bayerisches Landesamt für Umwelt 2024