
- Start >
- Rivers >
- Discharge >
- Unterer Main >
- Pfarrweisach >
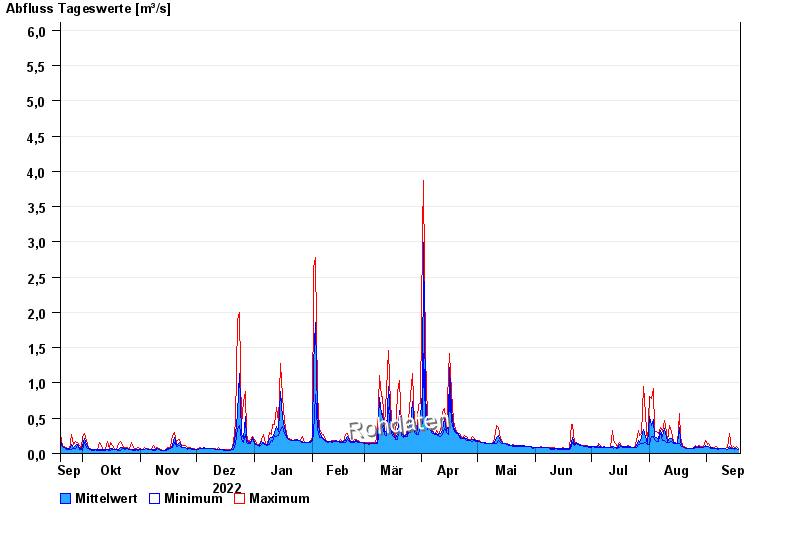
- Chart of year

Chart of year Pfarrweisach / Weisach
Discharge from 19.09.2022 to 18.09.2023
- 23.01.1995 Abfluss: 28,8 m³/s
- 08.12.1981 Abfluss: 17,6 m³/s
- 12.04.2008 Abfluss: 16,8 m³/s
- 05.01.1982 Abfluss: 16,5 m³/s
- 01.04.1988 Abfluss: 15,8 m³/s
| Date | Mean value [m³/s] | Maximum [m³/s] | Minimum [m³/s] |
|---|---|---|---|
| 18.09.2023 | 0.063 | 0.067 | 0.06 |
| 17.09.2023 | 0.068 | 0.093 | 0.067 |
| 16.09.2023 | 0.065 | 0.075 | 0.06 |
| 15.09.2023 | 0.072 | 0.102 | 0.067 |
| 14.09.2023 | 0.072 | 0.075 | 0.067 |
| 13.09.2023 | 0.106 | 0.281 | 0.075 |
| 12.09.2023 | 0.061 | 0.084 | 0.06 |
© Bayerisches Landesamt für Umwelt 2024