
- Start >
- Rivers >
- Discharge >
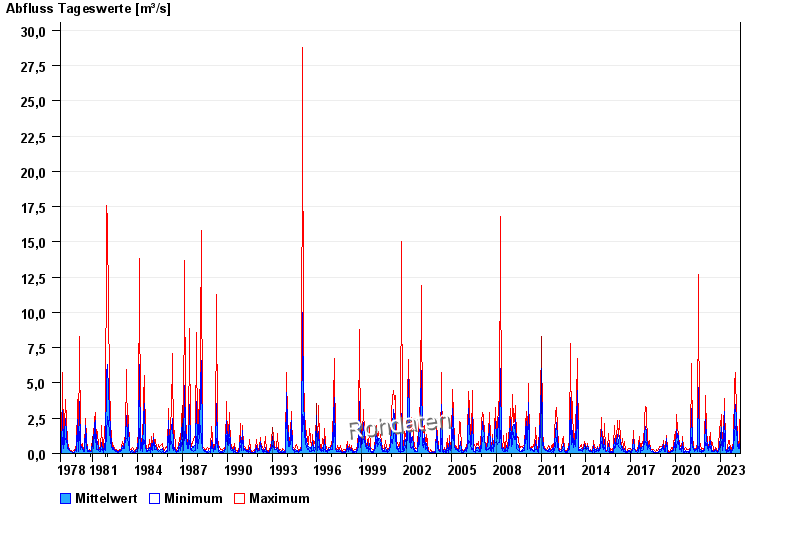
- Unterer Main >
- Pfarrweisach >
- Chart of total period

Chart of total period Pfarrweisach / Weisach
Discharge from 01.11.1978 to 07.05.2024
| Date | Mean value [m³/s] | Maximum [m³/s] | Minimum [m³/s] |
|---|---|---|---|
| 07.05.2024 | 0.35 | 0.374 | 0.339 |
| 06.05.2024 | 0.346 | 0.356 | 0.339 |
| 05.05.2024 | 0.364 | 0.41 | 0.322 |
| 04.05.2024 | 0.412 | 0.468 | 0.356 |
| 03.05.2024 | 1 | 2.85 | 0.468 |
| 02.05.2024 | 0.812 | 4.21 | 0.241 |
| 01.05.2024 | 0.241 | 0.241 | 0.241 |
© Bayerisches Landesamt für Umwelt 2024