
- Start >
- Rivers >
- Discharge >
- Unterer Main >
- Oberthulba >
- Chart of year

Chart of year Oberthulba / Thulba
Discharge from 24.10.2021 to 23.10.2022
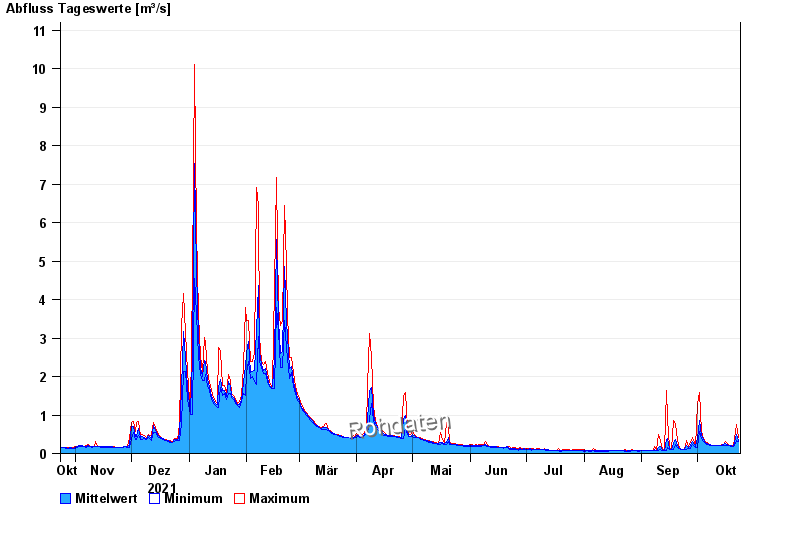
| Date | Mean value [m³/s] | Maximum [m³/s] | Minimum [m³/s] |
|---|---|---|---|
| 23.10.2022 | 0.349 | 0.427 | 0.309 |
| 22.10.2022 | 0.496 | 0.76 | 0.331 |
| 21.10.2022 | 0.282 | 0.402 | 0.205 |
| 20.10.2022 | 0.184 | 0.205 | 0.177 |
| 19.10.2022 | 0.199 | 0.22 | 0.177 |
| 18.10.2022 | 0.217 | 0.22 | 0.205 |
| 17.10.2022 | 0.236 | 0.269 | 0.22 |
© Bayerisches Landesamt für Umwelt 2024