
- Start >
- Rivers >
- Discharge >
- Unterer Main >
- Oberthulba >
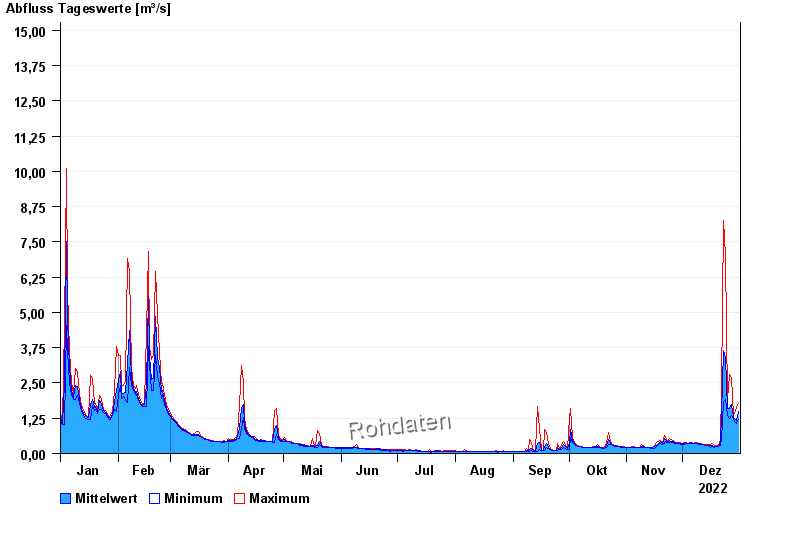
- Chart of year

Chart of year Oberthulba / Thulba
Discharge from 01.01.2022 to 31.12.2022
- 07.02.1984 Abfluss: 45,6 m³/s
- 23.01.1995 Abfluss: 43,5 m³/s
- 03.01.2003 Abfluss: 42,1 m³/s
- 13.01.2011 Abfluss: 30,1 m³/s
- 21.01.2005 Abfluss: 30,1 m³/s
| Date | Mean value [m³/s] | Maximum [m³/s] | Minimum [m³/s] |
|---|---|---|---|
| 31.12.2022 | 1.49 | 1.77 | 1.2 |
| 30.12.2022 | 1.18 | 1.63 | 1.05 |
| 29.12.2022 | 1.23 | 1.4 | 1.15 |
| 28.12.2022 | 1.26 | 1.35 | 1.2 |
| 27.12.2022 | 1.72 | 2.68 | 1.35 |
| 26.12.2022 | 1.58 | 2.79 | 1.25 |
| 25.12.2022 | 1.59 | 1.9 | 1.35 |
© Bayerisches Landesamt für Umwelt 2024