
- Start >
- Rivers >
- Discharge >
- Unterer Main >
- Oberthulba >
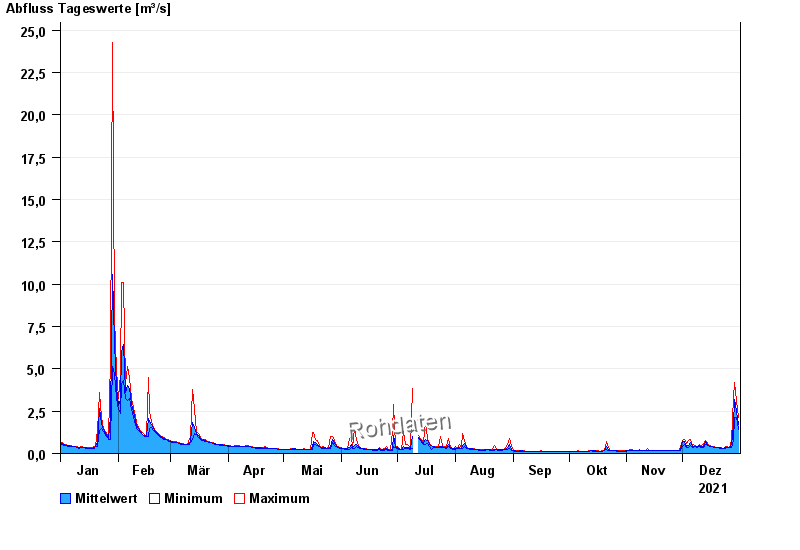
- Chart of year

Chart of year Oberthulba / Thulba
Discharge from 01.01.2021 to 31.12.2021
| Date | Mean value [m³/s] | Maximum [m³/s] | Minimum [m³/s] |
|---|---|---|---|
| 31.12.2021 | 1.72 | 2.13 | 1.4 |
| 30.12.2021 | 2.49 | 3.15 | 2.13 |
| 29.12.2021 | 3.16 | 4.17 | 2.13 |
| 28.12.2021 | 1.68 | 3.3 | 0.756 |
| 27.12.2021 | 0.519 | 0.756 | 0.328 |
| 26.12.2021 | 0.349 | 0.373 | 0.328 |
| 25.12.2021 | 0.375 | 0.397 | 0.35 |
© Bayerisches Landesamt für Umwelt 2024