
- Start >
- Rivers >
- Discharge >
- Unterer Main >
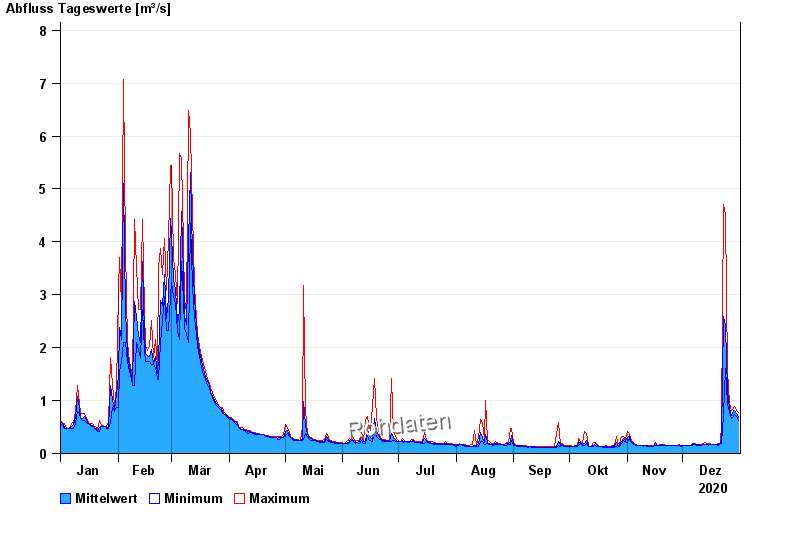
- Oberthulba >
- Chart of year

Chart of year Oberthulba / Thulba
Discharge from 01.01.2020 to 31.12.2020
| Date | Mean value [m³/s] | Maximum [m³/s] | Minimum [m³/s] |
|---|---|---|---|
| 31.12.2020 | 0.698 | 0.786 | 0.648 |
| 30.12.2020 | 0.765 | 0.824 | 0.715 |
| 29.12.2020 | 0.825 | 0.903 | 0.75 |
| 28.12.2020 | 0.819 | 0.863 | 0.714 |
| 27.12.2020 | 0.735 | 0.823 | 0.68 |
| 26.12.2020 | 0.851 | 0.944 | 0.786 |
| 25.12.2020 | 1.19 | 1.58 | 0.944 |
© Bayerisches Landesamt für Umwelt 2025