
- Start >
- Rivers >
- Discharge >
- Unterer Main >
- Oberthulba >
- Chart of year

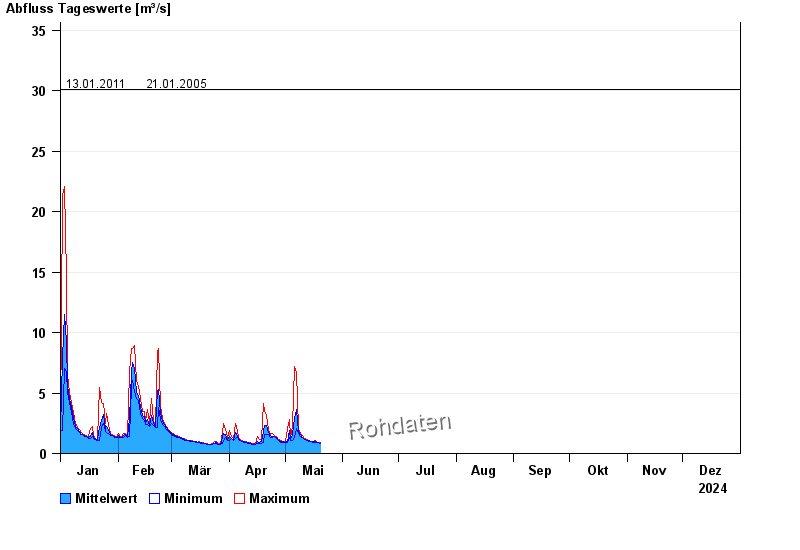
Chart of year Oberthulba / Thulba
Discharge from 01.01.2024 to 31.12.2024
- 07.02.1984 Abfluss: 45,6 m³/s
- 23.01.1995 Abfluss: 43,5 m³/s
- 03.01.2003 Abfluss: 42,1 m³/s
- 13.01.2011 Abfluss: 30,1 m³/s
- 21.01.2005 Abfluss: 30,1 m³/s
| Date | Mean value [m³/s] | Maximum [m³/s] | Minimum [m³/s] |
|---|---|---|---|
| 10.05.2024 | 1.4 | 1.46 | 1.35 |
| 09.05.2024 | 1.53 | 1.62 | 1.4 |
| 08.05.2024 | 1.83 | 2.1 | 1.62 |
| 07.05.2024 | 3.64 | 6.69 | 2.1 |
| 06.05.2024 | 2.86 | 7.18 | 1.35 |
| 05.05.2024 | 1.57 | 2.24 | 1.05 |
| 04.05.2024 | 1.18 | 1.3 | 1.05 |
© Bayerisches Landesamt für Umwelt 2024