
- Start >
- Rivers >
- Discharge >
- Unterer Main >
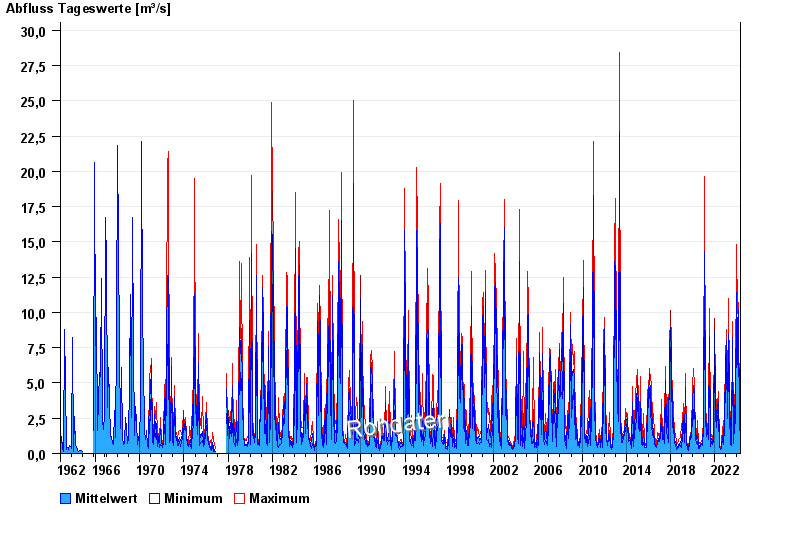
- Lohr >
- Chart of total period

Chart of total period Lohr / Baunach
Discharge from 01.11.1962 to 28.04.2024
| Date | Mean value [m³/s] | Maximum [m³/s] | Minimum [m³/s] |
|---|---|---|---|
| 28.04.2024 | 0.793 | 0.798 | 0.774 |
| 27.04.2024 | 0.84 | 0.9 | 0.798 |
| 26.04.2024 | 0.918 | 0.952 | 0.875 |
| 25.04.2024 | 0.962 | 1.03 | 0.699 |
| 24.04.2024 | 1.09 | 1.17 | 1.03 |
| 23.04.2024 | 1.31 | 1.51 | 1.17 |
| 22.04.2024 | 1.86 | 2.25 | 1.51 |
© Bayerisches Landesamt für Umwelt 2024