
- Start >
- Rivers >
- Discharge >
- Unterer Main >
- Leucherhof >
- Chart of year

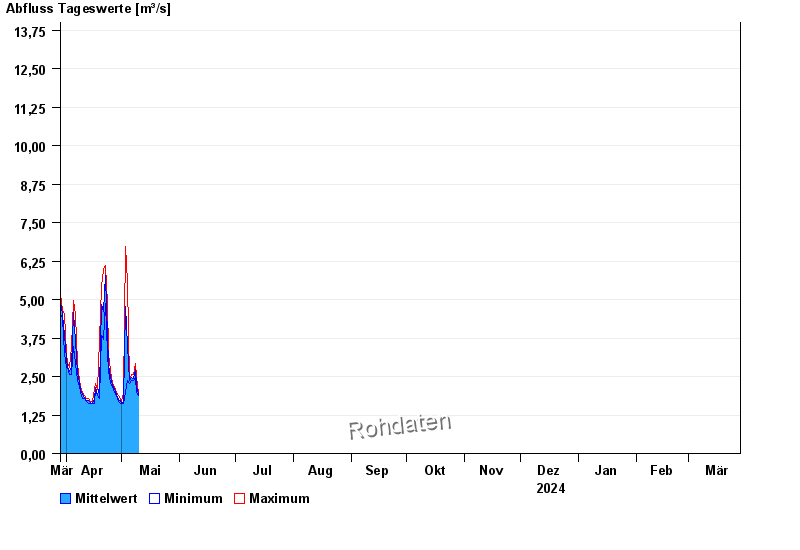
Chart of year Leucherhof / Baunach
Discharge from 29.03.2024 to 28.03.2025
- HQ1 22 m³/s
- HQ2 30 m³/s
- HQ5 40 m³/s
- HQ10 50 m³/s
- HQ20 60 m³/s
- HQ50 72 m³/s
- HQ100 85 m³/s
| Date | Mean value [m³/s] | Maximum [m³/s] | Minimum [m³/s] |
|---|---|---|---|
| 10.05.2024 | 1.94 | 1.97 | 1.88 |
| 09.05.2024 | 2.22 | 2.47 | 1.97 |
| 08.05.2024 | 2.73 | 2.91 | 2.47 |
| 07.05.2024 | 2.42 | 2.58 | 2.37 |
| 06.05.2024 | 2.46 | 2.58 | 2.37 |
| 05.05.2024 | 2.36 | 2.37 | 2.27 |
| 04.05.2024 | 3.51 | 5.54 | 2.37 |
© Bayerisches Landesamt für Umwelt 2024