
- Start >
- Rivers >
- Discharge >
- Unterer Main >
- Leucherhof >
- Chart of year

Chart of year Leucherhof / Baunach
Discharge from 01.01.2018 to 31.12.2018
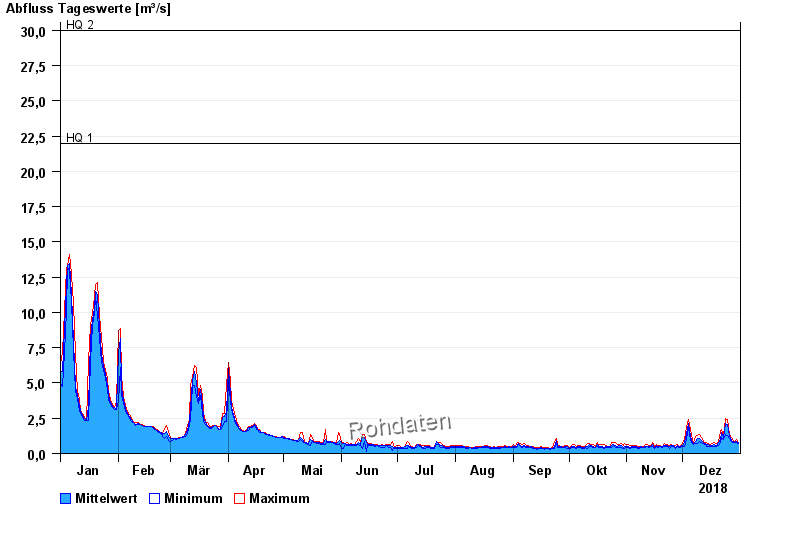
- HQ1 22 m³/s
- HQ2 30 m³/s
- HQ5 40 m³/s
- HQ10 50 m³/s
- HQ20 60 m³/s
- HQ50 72 m³/s
- HQ100 85 m³/s
| Date | Mean value [m³/s] | Maximum [m³/s] | Minimum [m³/s] |
|---|---|---|---|
| 31.12.2018 | 0.762 | 0.813 | 0.695 |
| 30.12.2018 | 0.885 | 1.01 | 0.751 |
| 29.12.2018 | 0.803 | 0.877 | 0.751 |
| 28.12.2018 | 0.877 | 0.943 | 0.813 |
| 27.12.2018 | 0.947 | 1.15 | 0.877 |
| 26.12.2018 | 1.25 | 1.38 | 1.08 |
| 25.12.2018 | 2.02 | 2.4 | 1.3 |
© Bayerisches Landesamt für Umwelt 2024