
- Start >
- Rivers >
- Discharge >
- Unterer Main >
- Leucherhof >
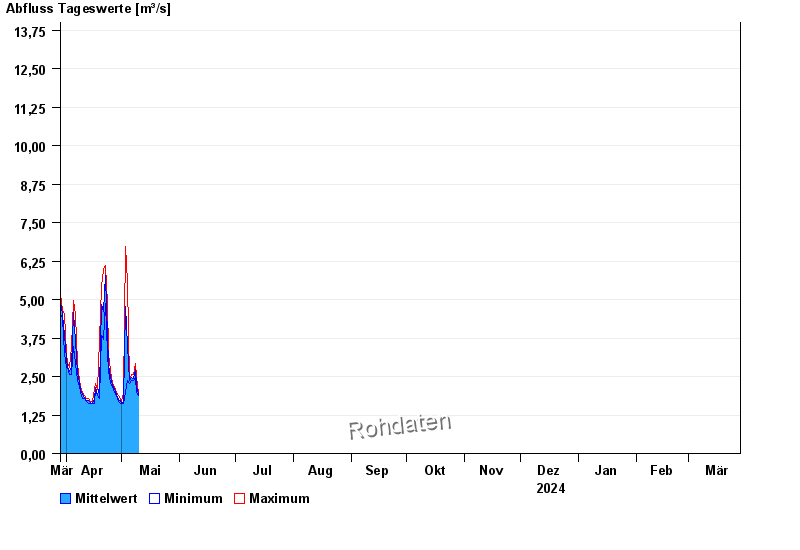
- Chart of year

Chart of year Leucherhof / Baunach
Discharge from 29.03.2024 to 28.03.2025
- HQ1 22 m³/s
- HQ2 30 m³/s
- HQ5 40 m³/s
- HQ10 50 m³/s
- HQ20 60 m³/s
- HQ50 72 m³/s
- HQ100 85 m³/s
| Date | Mean value [m³/s] | Maximum [m³/s] | Minimum [m³/s] |
|---|---|---|---|
| 15.05.2024 | 1.39 | 1.44 | 1.36 |
| 14.05.2024 | 1.44 | 1.44 | 1.44 |
| 13.05.2024 | 1.5 | 1.52 | 1.44 |
| 12.05.2024 | 1.6 | 1.7 | 1.52 |
| 11.05.2024 | 1.69 | 1.79 | 1.61 |
| 10.05.2024 | 1.9 | 1.97 | 1.79 |
| 09.05.2024 | 2.22 | 2.47 | 1.97 |
© Bayerisches Landesamt für Umwelt 2024