
- Start >
- Rivers >
- Discharge >
- Unterer Main >
- Lentersdorf >
- Chart of year

Chart of year Lentersdorf / Bibert
Discharge from 29.01.2020 to 28.01.2021
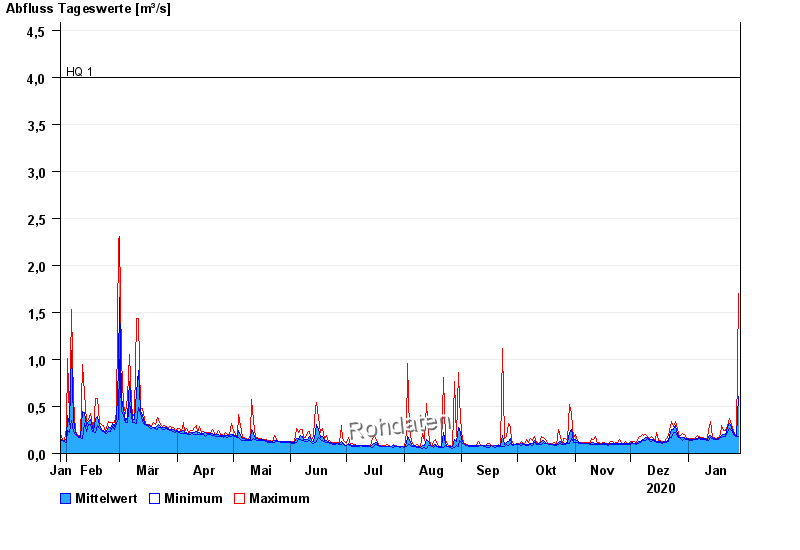
- HQ1 4 m³/s
- HQ2 6 m³/s
- HQ5 8,72 m³/s
- HQ10 11,8 m³/s
- HQ20 15,2 m³/s
- HQ50 20,8 m³/s
- HQ100 25,6 m³/s
| Date | Mean value [m³/s] | Maximum [m³/s] | Minimum [m³/s] |
|---|---|---|---|
| 28.01.2021 | 0.61 | 1.7 | 0.185 |
| 27.01.2021 | 0.192 | 0.202 | 0.179 |
| 26.01.2021 | 0.203 | 0.214 | 0.196 |
| 25.01.2021 | 0.223 | 0.244 | 0.201 |
| 24.01.2021 | 0.279 | 0.303 | 0.241 |
| 23.01.2021 | 0.319 | 0.371 | 0.261 |
| 22.01.2021 | 0.273 | 0.302 | 0.219 |
© Bayerisches Landesamt für Umwelt 2024