
- Start >
- Rivers >
- Discharge >
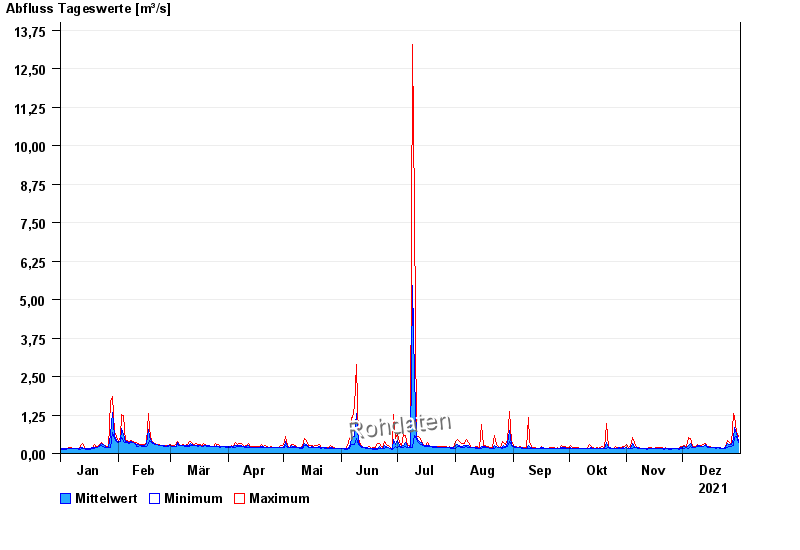
- Unterer Main >
- Lentersdorf >
- Chart of year

Chart of year Lentersdorf / Bibert
Discharge from 01.01.2021 to 31.12.2021
| Date | Mean value [m³/s] | Maximum [m³/s] | Minimum [m³/s] |
|---|---|---|---|
| 31.12.2021 | 0.41 | 0.539 | 0.349 |
| 30.12.2021 | 0.639 | 0.696 | 0.539 |
| 29.12.2021 | 0.83 | 1.19 | 0.515 |
| 28.12.2021 | 0.477 | 1.3 | 0.247 |
| 27.12.2021 | 0.281 | 0.338 | 0.234 |
| 26.12.2021 | 0.282 | 0.362 | 0.24 |
| 25.12.2021 | 0.319 | 0.409 | 0.205 |
© Bayerisches Landesamt für Umwelt 2024