
- Start >
- Rivers >
- Discharge >
- Unterer Main >
- Laubendorf >
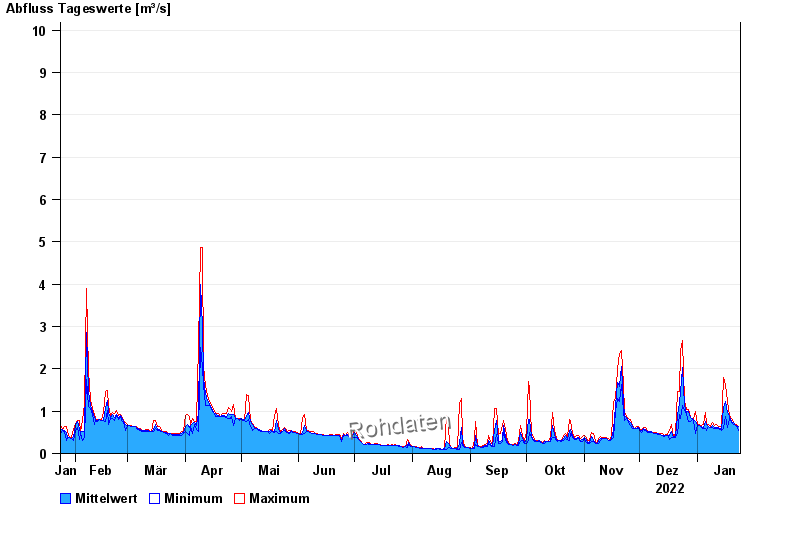
- Chart of year

Chart of year Laubendorf / Zenn
Discharge from 24.01.2022 to 23.01.2023
- HQ1 12 m³/s
- HQ2 18 m³/s
- HQ5 27 m³/s
- HQ10 37 m³/s
- HQ20 48 m³/s
- HQ50 68 m³/s
- HQ100 86 m³/s
| Date | Mean value [m³/s] | Maximum [m³/s] | Minimum [m³/s] |
|---|---|---|---|
| 23.01.2023 | 0.633 | 0.642 | 0.552 |
| 22.01.2023 | 0.65 | 0.688 | 0.642 |
| 21.01.2023 | 0.688 | 0.688 | 0.688 |
| 20.01.2023 | 0.725 | 0.737 | 0.688 |
| 19.01.2023 | 0.763 | 0.833 | 0.737 |
| 18.01.2023 | 0.871 | 0.907 | 0.833 |
| 17.01.2023 | 0.971 | 1.24 | 0.62 |
© Bayerisches Landesamt für Umwelt 2024