
- Start >
- Rivers >
- Discharge >
- Unterer Main >
- Laubendorf >
- Chart of year

Chart of year Laubendorf / Zenn
Discharge from 22.05.2022 to 21.05.2023
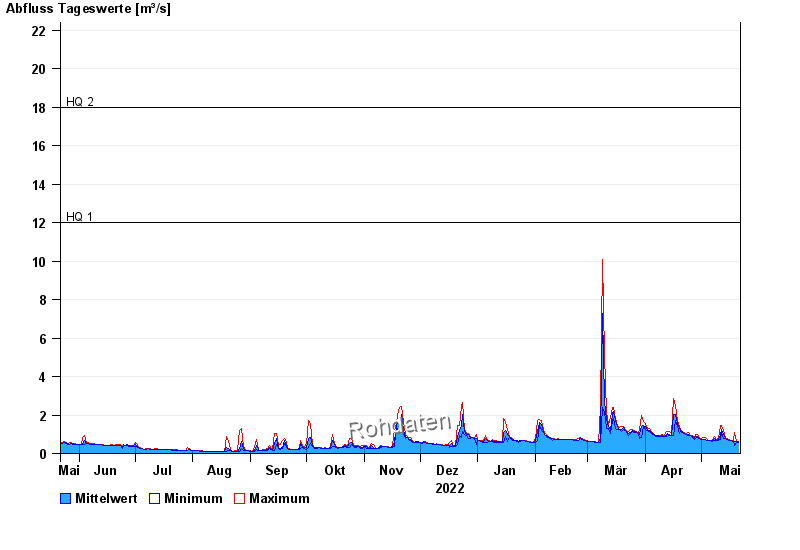
- HQ1 12 m³/s
- HQ2 18 m³/s
- HQ5 27 m³/s
- HQ10 37 m³/s
- HQ20 48 m³/s
- HQ50 68 m³/s
- HQ100 86 m³/s
| Date | Mean value [m³/s] | Maximum [m³/s] | Minimum [m³/s] |
|---|---|---|---|
| 21.05.2023 | 0.609 | 0.643 | 0.597 |
| 20.05.2023 | 0.623 | 0.643 | 0.597 |
| 19.05.2023 | 0.621 | 1.08 | 0.391 |
| 18.05.2023 | 0.646 | 0.666 | 0.643 |
| 17.05.2023 | 0.687 | 0.69 | 0.666 |
| 16.05.2023 | 0.694 | 0.735 | 0.69 |
| 15.05.2023 | 0.734 | 0.761 | 0.714 |
© Bayerisches Landesamt für Umwelt 2024