
- Start >
- Rivers >
- Discharge >
- Unterer Main >
- Laubendorf >
- Chart of year

Chart of year Laubendorf / Zenn
Discharge from 01.01.2022 to 31.12.2022
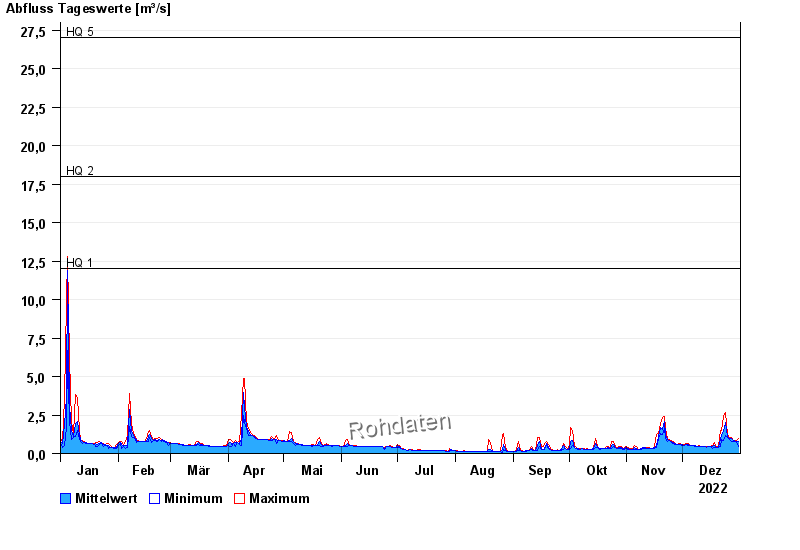
- HQ1 12 m³/s
- HQ2 18 m³/s
- HQ5 27 m³/s
- HQ10 37 m³/s
- HQ20 48 m³/s
- HQ50 68 m³/s
- HQ100 86 m³/s
| Date | Mean value [m³/s] | Maximum [m³/s] | Minimum [m³/s] |
|---|---|---|---|
| 31.12.2022 | 0.759 | 0.983 | 0.464 |
| 30.12.2022 | 0.794 | 0.833 | 0.76 |
| 29.12.2022 | 0.818 | 0.833 | 0.808 |
| 28.12.2022 | 0.852 | 0.859 | 0.76 |
| 27.12.2022 | 0.992 | 1.04 | 0.76 |
| 26.12.2022 | 0.968 | 1.04 | 0.933 |
| 25.12.2022 | 1.13 | 1.24 | 1.01 |
© Bayerisches Landesamt für Umwelt 2024