
- Start >
- Rivers >
- Discharge >
- Unterer Main >
- Laubendorf >
- Chart of year

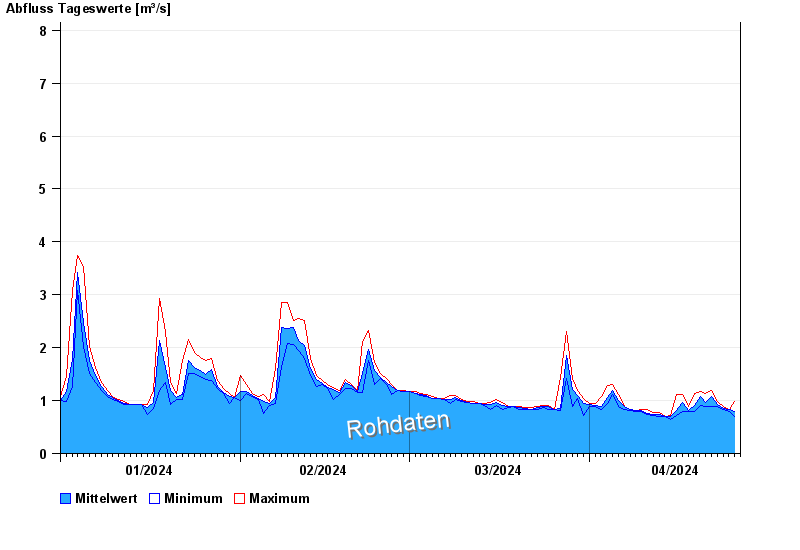
Chart of year Laubendorf / Zenn
Discharge from 01.01.2024 to 26.04.2024
- HQ1 12 m³/s
- HQ2 18 m³/s
- HQ5 27 m³/s
- HQ10 37 m³/s
- HQ20 48 m³/s
- HQ50 68 m³/s
- HQ100 86 m³/s
| Date | Mean value [m³/s] | Maximum [m³/s] | Minimum [m³/s] |
|---|---|---|---|
| 26.04.2024 | 0.792 | 0.99 | 0.699 |
| 25.04.2024 | 0.833 | 0.839 | 0.792 |
| 24.04.2024 | 0.846 | 0.893 | 0.839 |
| 23.04.2024 | 0.917 | 0.99 | 0.893 |
| 22.04.2024 | 1.08 | 1.2 | 0.893 |
| 21.04.2024 | 0.959 | 1.14 | 0.893 |
| 20.04.2024 | 1.07 | 1.17 | 0.915 |
© Bayerisches Landesamt für Umwelt 2024