
- Start >
- Rivers >
- Discharge >
- Unterer Main >
- Heinersdorf >
- Chart of year

Chart of year Heinersdorf / Rodach
Discharge from 29.10.2020 to 28.10.2021
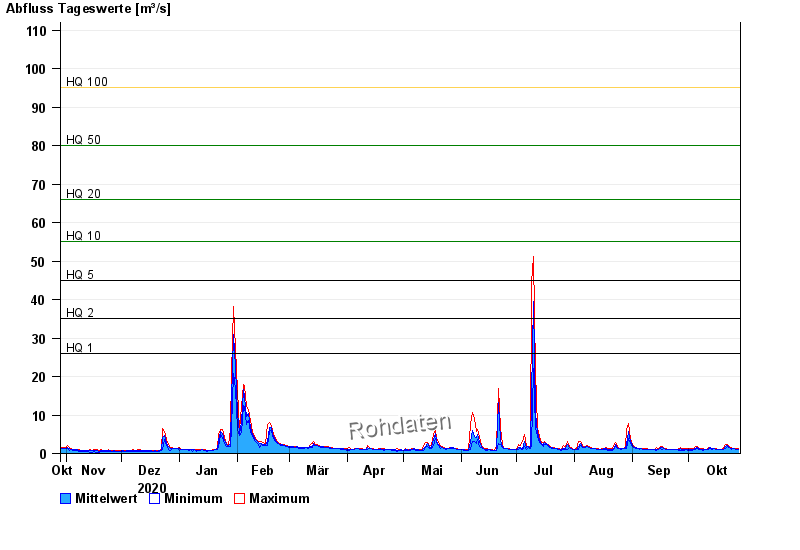
- HQ1 26 m³/s
- HQ2 35 m³/s
- HQ5 45 m³/s
- HQ10 55 m³/s
- HQ20 66 m³/s
- HQ50 80 m³/s
- HQ100 95 m³/s
| Date | Mean value [m³/s] | Maximum [m³/s] | Minimum [m³/s] |
|---|---|---|---|
| 28.10.2021 | 1.14 | 1.18 | 1.1 |
| 27.10.2021 | 1.15 | 1.18 | 1.1 |
| 26.10.2021 | 1.19 | 1.23 | 1.18 |
| 25.10.2021 | 1.23 | 1.27 | 1.18 |
| 24.10.2021 | 1.32 | 1.46 | 1.14 |
| 23.10.2021 | 1.58 | 1.77 | 1.46 |
| 22.10.2021 | 2 | 2.3 | 1.77 |
© Bayerisches Landesamt für Umwelt 2024