
- Start >
- Rivers >
- Discharge >
- Unterer Main >
- Heinersdorf >
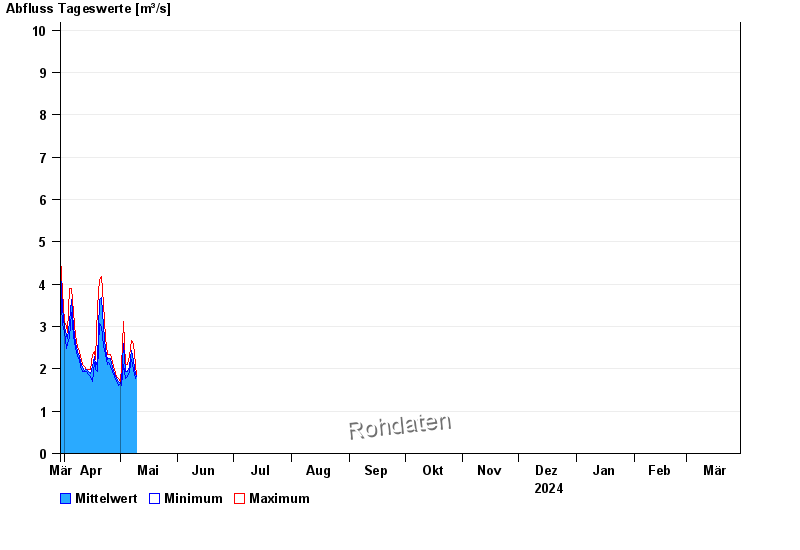
- Chart of year

Chart of year Heinersdorf / Rodach
Discharge from 30.03.2024 to 29.03.2025
- HQ1 26 m³/s
- HQ2 35 m³/s
- HQ5 45 m³/s
- HQ10 55 m³/s
- HQ20 66 m³/s
- HQ50 80 m³/s
- HQ100 95 m³/s
| Date | Mean value [m³/s] | Maximum [m³/s] | Minimum [m³/s] |
|---|---|---|---|
| 27.04.2024 | 2.08 | 2.16 | 1.99 |
| 26.04.2024 | 2.24 | 2.34 | 2.05 |
| 25.04.2024 | 2.25 | 2.34 | 2.16 |
| 24.04.2024 | 2.23 | 2.34 | 2.11 |
| 23.04.2024 | 2.46 | 2.73 | 2.34 |
| 22.04.2024 | 3 | 3.54 | 2.53 |
| 21.04.2024 | 3.69 | 4.19 | 2.99 |
© Bayerisches Landesamt für Umwelt 2024