
- Start >
- Rivers >
- Discharge >
- Unterer Main >
- Harburg >
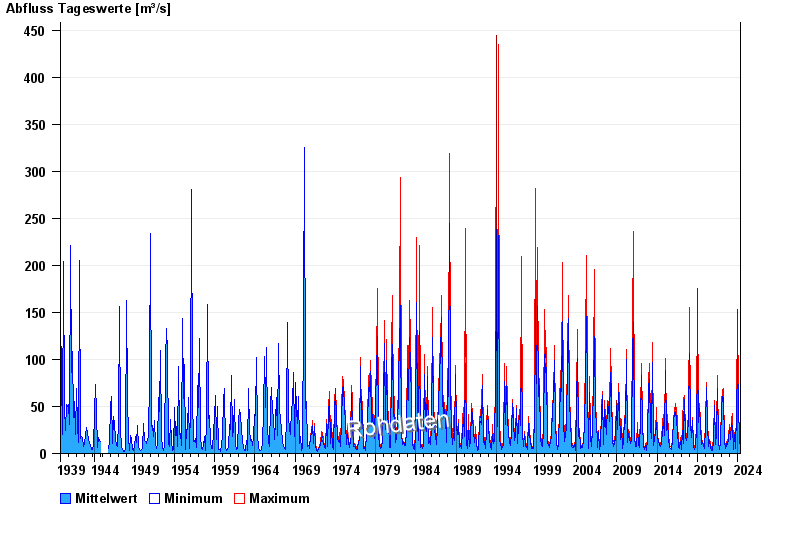
- Chart of total period

Chart of total period Harburg / Wörnitz
Discharge from 01.11.1939 to 10.05.2024
| Date | Mean value [m³/s] | Maximum [m³/s] | Minimum [m³/s] |
|---|---|---|---|
| 10.05.2024 | 5.3 | 5.34 | 5.11 |
| 09.05.2024 | 5.42 | 6.75 | 4.88 |
| 08.05.2024 | 7.71 | 8.43 | 6.99 |
| 07.05.2024 | 8.49 | 9.17 | 7.23 |
| 06.05.2024 | 6.91 | 7.44 | 6.27 |
| 05.05.2024 | 7.13 | 7.7 | 6.27 |
| 04.05.2024 | 7.13 | 7.96 | 6.27 |
© Bayerisches Landesamt für Umwelt 2024