
- Start >
- Rivers >
- Discharge >
- Unterer Main >
- Hafenlohr >
- Chart of year

Chart of year Hafenlohr / Hafenlohr
Discharge from 21.09.2019 to 20.09.2020
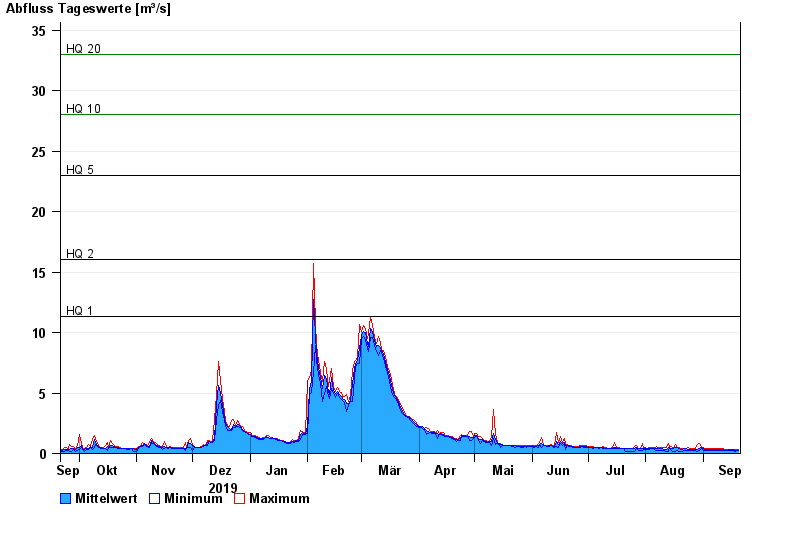
- HQ1 11,3 m³/s
- HQ2 16 m³/s
- HQ5 23 m³/s
- HQ10 28 m³/s
- HQ20 33 m³/s
- HQ50 40 m³/s
- HQ100 45 m³/s
| Date | Mean value [m³/s] | Maximum [m³/s] | Minimum [m³/s] |
|---|---|---|---|
| 20.09.2020 | 0.284 | 0.359 | 0.209 |
| 19.09.2020 | 0.282 | 0.36 | 0.21 |
| 18.09.2020 | 0.285 | 0.362 | 0.181 |
| 17.09.2020 | 0.295 | 0.363 | 0.211 |
| 16.09.2020 | 0.295 | 0.365 | 0.212 |
| 15.09.2020 | 0.291 | 0.366 | 0.213 |
| 14.09.2020 | 0.288 | 0.368 | 0.214 |
© Bayerisches Landesamt für Umwelt 2024