
- Start >
- Rivers >
- Discharge >
- Unterer Main >
- Hafenlohr >
- Chart of year

Chart of year Hafenlohr / Hafenlohr
Discharge from 20.11.2021 to 19.11.2022
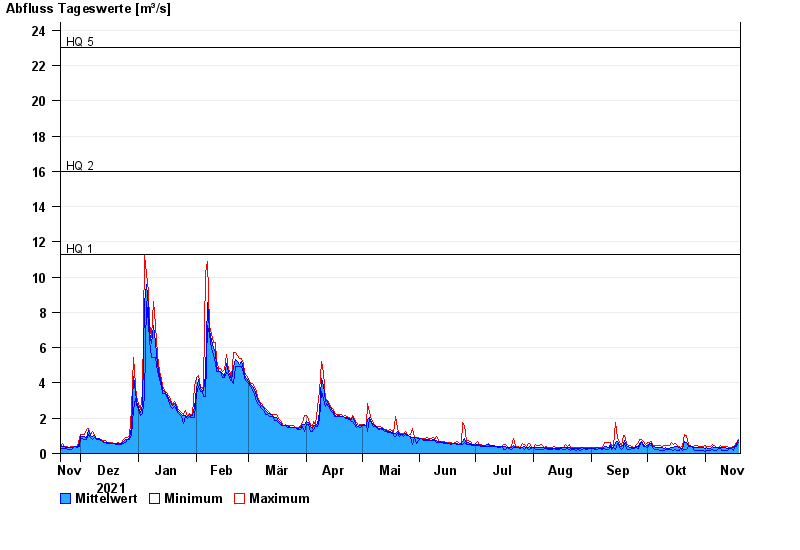
- HQ1 11,3 m³/s
- HQ2 16 m³/s
- HQ5 23 m³/s
- HQ10 28 m³/s
- HQ20 33 m³/s
- HQ50 40 m³/s
- HQ100 45 m³/s
| Date | Mean value [m³/s] | Maximum [m³/s] | Minimum [m³/s] |
|---|---|---|---|
| 19.11.2022 | 0.739 | 0.835 | 0.654 |
| 18.11.2022 | 0.565 | 0.654 | 0.446 |
| 17.11.2022 | 0.422 | 0.494 | 0.4 |
| 16.11.2022 | 0.373 | 0.446 | 0.208 |
| 15.11.2022 | 0.33 | 0.356 | 0.316 |
| 14.11.2022 | 0.328 | 0.4 | 0.316 |
| 13.11.2022 | 0.328 | 0.446 | 0.208 |
© Bayerisches Landesamt für Umwelt 2024