
- Start >
- Rivers >
- Discharge >
- Unterer Main >
- Hafenlohr >
- Chart of year

Chart of year Hafenlohr / Hafenlohr
Discharge from 18.01.2022 to 17.01.2023
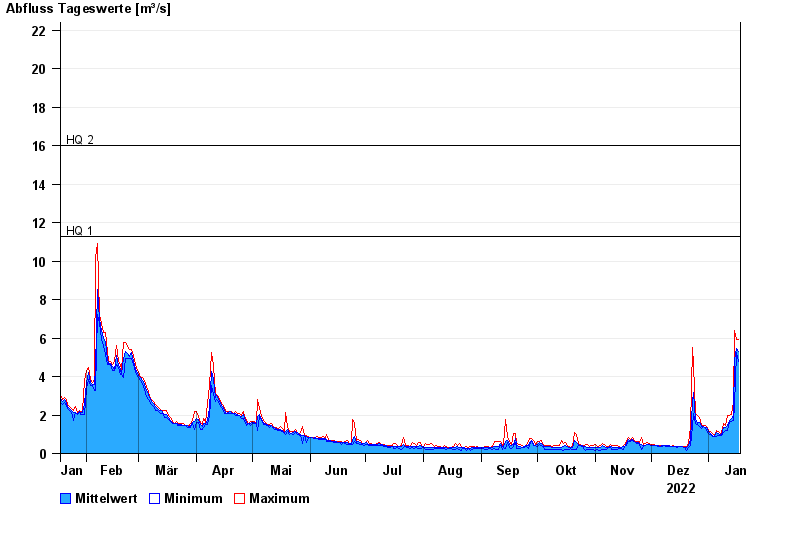
- HQ1 11,3 m³/s
- HQ2 16 m³/s
- HQ5 23 m³/s
- HQ10 28 m³/s
- HQ20 33 m³/s
- HQ50 40 m³/s
- HQ100 45 m³/s
| Date | Mean value [m³/s] | Maximum [m³/s] | Minimum [m³/s] |
|---|---|---|---|
| 17.01.2023 | 5.29 | 5.91 | 4.79 |
| 16.01.2023 | 5.47 | 5.91 | 5.27 |
| 15.01.2023 | 4.87 | 6.41 | 2.51 |
| 14.01.2023 | 1.97 | 2.63 | 1.74 |
| 13.01.2023 | 1.83 | 2.05 | 1.64 |
| 12.01.2023 | 1.69 | 1.95 | 1.64 |
| 11.01.2023 | 1.44 | 1.95 | 1.19 |
© Bayerisches Landesamt für Umwelt 2024