
- Start >
- Rivers >
- Discharge >
- Unterer Main >
- Hafenlohr >
- Chart of year

Chart of year Hafenlohr / Hafenlohr
Discharge from 18.01.2020 to 17.01.2021
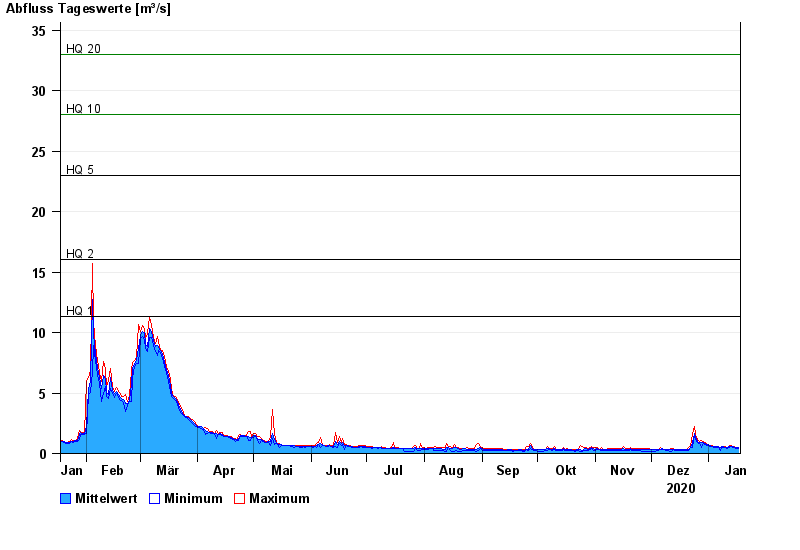
- HQ1 11,3 m³/s
- HQ2 16 m³/s
- HQ5 23 m³/s
- HQ10 28 m³/s
- HQ20 33 m³/s
- HQ50 40 m³/s
- HQ100 45 m³/s
| Date | Mean value [m³/s] | Maximum [m³/s] | Minimum [m³/s] |
|---|---|---|---|
| 17.01.2021 | 0.494 | 0.497 | 0.444 |
| 16.01.2021 | 0.492 | 0.495 | 0.443 |
| 15.01.2021 | 0.506 | 0.549 | 0.493 |
| 14.01.2021 | 0.546 | 0.548 | 0.492 |
| 13.01.2021 | 0.612 | 0.667 | 0.546 |
| 12.01.2021 | 0.563 | 0.667 | 0.488 |
| 11.01.2021 | 0.483 | 0.488 | 0.436 |
© Bayerisches Landesamt für Umwelt 2024