
- Start >
- Rivers >
- Discharge >
- Unterer Main >
- Hafenlohr >
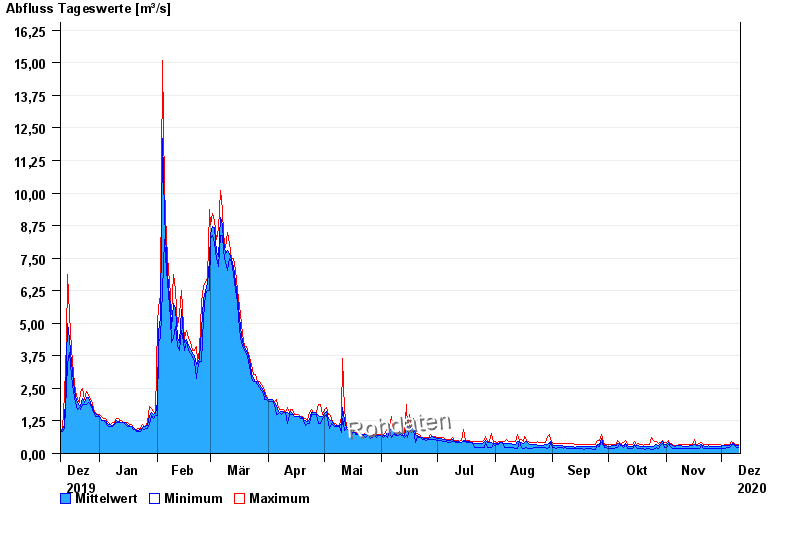
- Chart of year

Chart of year Hafenlohr / Hafenlohr
Discharge from 11.12.2019 to 10.12.2020
| Date | Mean value [m³/s] | Maximum [m³/s] | Minimum [m³/s] |
|---|---|---|---|
| 10.12.2020 | 0.311 | 0.363 | 0.244 |
| 09.12.2020 | 0.314 | 0.364 | 0.212 |
| 08.12.2020 | 0.361 | 0.366 | 0.322 |
| 07.12.2020 | 0.38 | 0.413 | 0.366 |
| 06.12.2020 | 0.36 | 0.464 | 0.325 |
| 05.12.2020 | 0.323 | 0.369 | 0.216 |
| 04.12.2020 | 0.304 | 0.37 | 0.216 |
© Bayerisches Landesamt für Umwelt 2024