
- Start >
- Rivers >
- Discharge >
- Unterer Main >
- Hafenlohr >
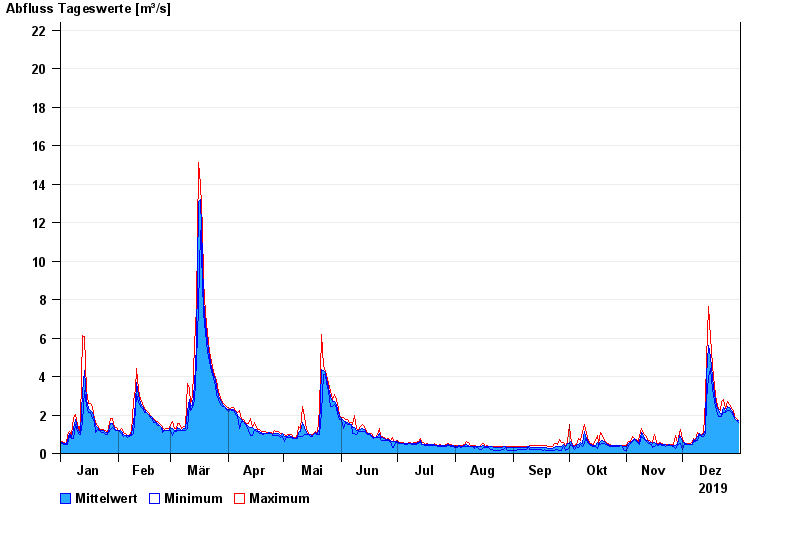
- Chart of year

Chart of year Hafenlohr / Hafenlohr
Discharge from 01.01.2019 to 31.12.2019
- 26.01.1995 Abfluss: 38,6 m³/s
- 14.01.2011 Abfluss: 34,3 m³/s
- 03.01.2003 Abfluss: 29,2 m³/s
- 21.12.1993 Abfluss: 28,6 m³/s
- 28.10.1998 Abfluss: 27,3 m³/s
| Date | Mean value [m³/s] | Maximum [m³/s] | Minimum [m³/s] |
|---|---|---|---|
| 31.12.2019 | 1.69 | 1.7 | 1.6 |
| 30.12.2019 | 1.74 | 1.8 | 1.7 |
| 29.12.2019 | 1.81 | 1.9 | 1.8 |
| 28.12.2019 | 2.01 | 2.23 | 1.9 |
| 27.12.2019 | 2.23 | 2.34 | 2.12 |
| 26.12.2019 | 2.41 | 2.57 | 2.23 |
| 25.12.2019 | 2.42 | 2.7 | 2.23 |
© Bayerisches Landesamt für Umwelt 2024